Fig. 7.
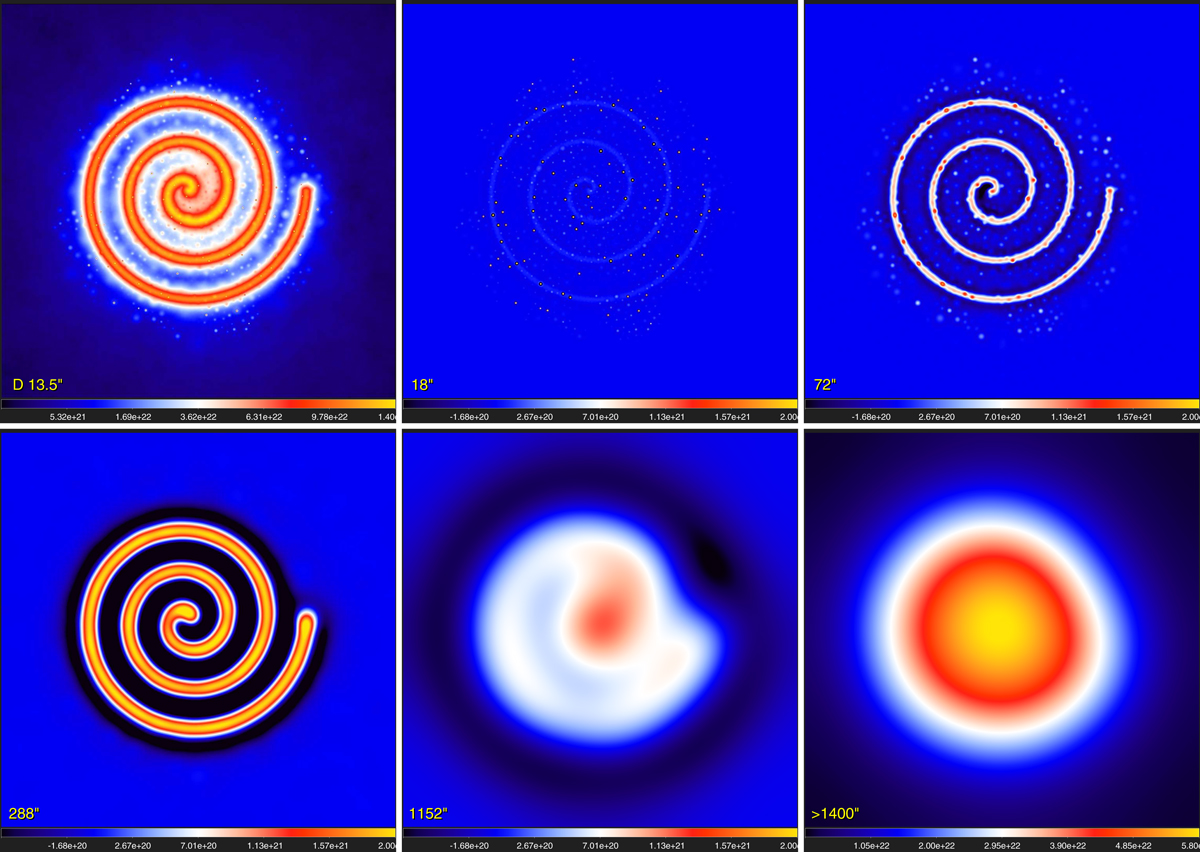
Spatial decomposition (Sect. 3.2.1, Appendix B) for ℐƛ ≡ 𝒟13″ from Eq. (8) in single scales between 4 and 1400″. The original hires surface density (top left) and decomposed ℐƛj on selected scales Sj that differ by a factor of 4 are plotted. The remaining largest scales 𝒢NS∗ℐƛ (bottom right) are outside the decomposition range. Linear color mapping.
Current usage metrics show cumulative count of Article Views (full-text article views including HTML views, PDF and ePub downloads, according to the available data) and Abstracts Views on Vision4Press platform.
Data correspond to usage on the plateform after 2015. The current usage metrics is available 48-96 hours after online publication and is updated daily on week days.
Initial download of the metrics may take a while.