Fig. 5.
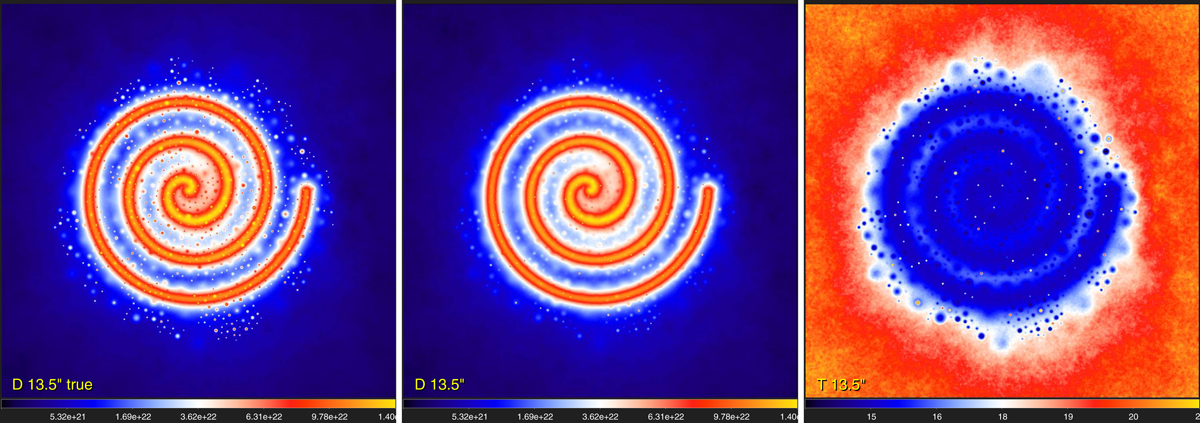
Derived surface densities and temperatures (Sect. 3.1.2). The true model image 𝒟C + 𝒟S and the hires surface density 𝒟13″ and temperature 𝒯13″ derived from Eq. (8) with λH = 160 μm (OH = 13.5″) are shown. Many of the sources, clearly visible in the true image (left), are not discernible in the derived surface density (middle) because of the inaccuracies in the temperatures from fitting spectral shapes Πλ. Square-root color mapping, except the right panel with linear mapping.
Current usage metrics show cumulative count of Article Views (full-text article views including HTML views, PDF and ePub downloads, according to the available data) and Abstracts Views on Vision4Press platform.
Data correspond to usage on the plateform after 2015. The current usage metrics is available 48-96 hours after online publication and is updated daily on week days.
Initial download of the metrics may take a while.