Fig. A.1.
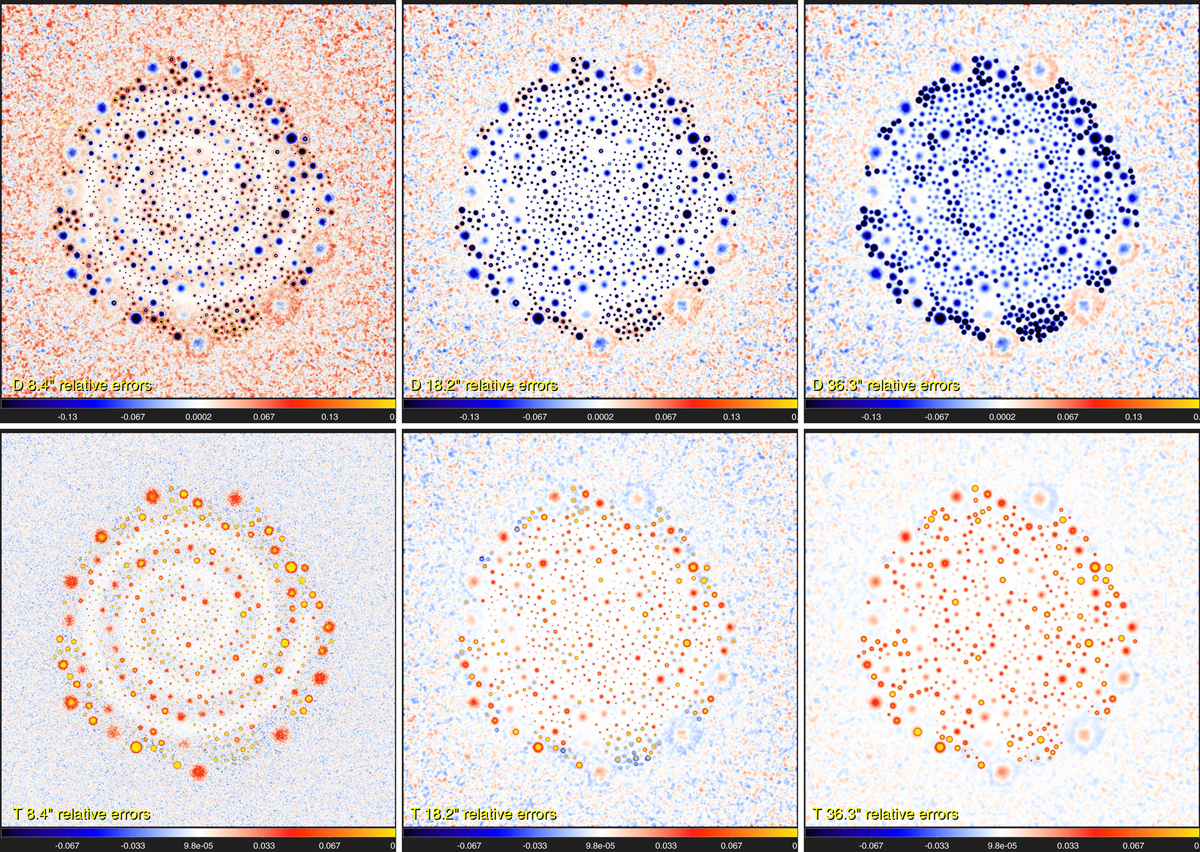
Relative accuracies ϵ of the hires surface densities and temperatures derived from Eq. (8) (Sect. 3.1.2) with respect to the true model images convolved to the same resolutions. The top row shows the errors in 𝒟8″ (σ = 0.15), 𝒟18″ (σ = 0.06), and 𝒟36″ (σ = 0.05) and the bottom row shows the errors in 𝒯8″ (σ = 0.06), 𝒯18″ (σ = 0.05), and 𝒯36″ (σ = 0.05). At the highest resolution of 8″, the derived images are the most accurate, with the exception of the unresolved protostellar peak surface densities (Fig. 3), which become strongly overestimated (up to a factor of ∼10) because the temperatures 𝒯{2|3|4} along the lines of sight with large temperature gradients are underestimated. The range of displayed values is reduced for better visibility. Linear color mapping.
Current usage metrics show cumulative count of Article Views (full-text article views including HTML views, PDF and ePub downloads, according to the available data) and Abstracts Views on Vision4Press platform.
Data correspond to usage on the plateform after 2015. The current usage metrics is available 48-96 hours after online publication and is updated daily on week days.
Initial download of the metrics may take a while.