Fig. 20.
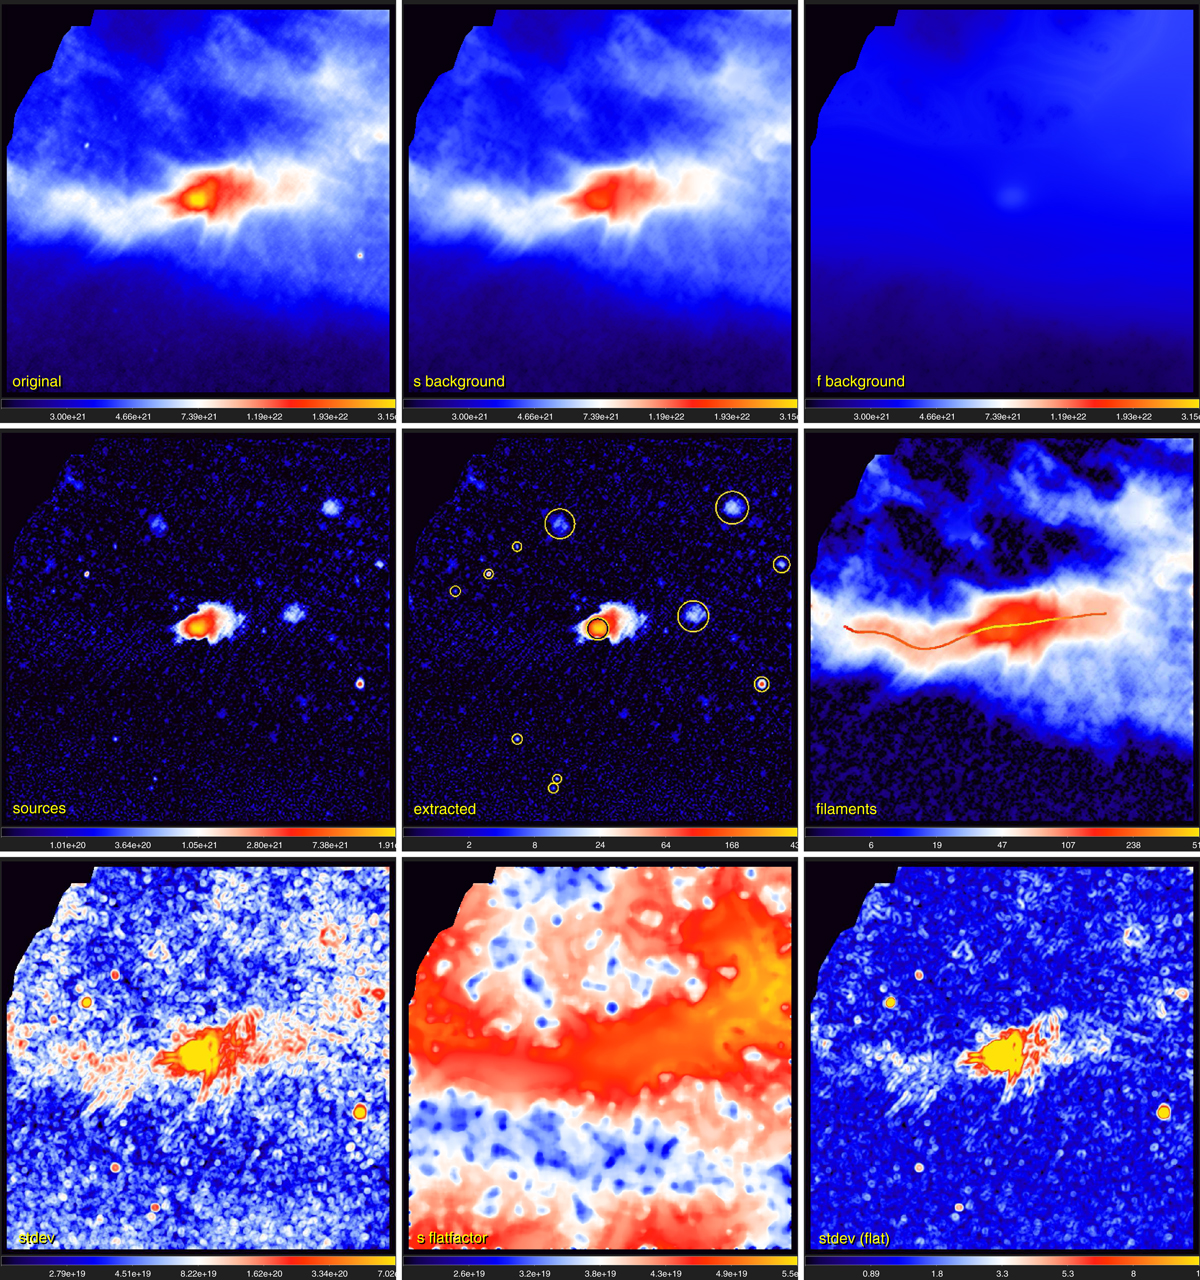
Application of getsf to the Herschel surface density (13.5″ resolution) of the starless core L 1689B, embedded in a filament, adopting {X|Y}λ = {90, 180}″. The top row shows the original hires image 𝒟13″ obtained from Eq. (8) and the backgrounds ℬλ{X|Y} of sources and filaments. The middle row shows the component 𝒮λ, the footprint ellipses of 12 acceptably good sources on 𝒮λD, and the component ℱλD with one skeleton 𝒦k2 corresponding to the scales Sk ≈ 200″. The bottom row shows the standard deviations 𝒰λ in the regularized component 𝒮λR, the flattening image 𝒬λ, and the standard deviations in the flattened component ![]() . Surface densities (in NH2 cm−2) are limited in range with logarithmic color mapping, except for 𝒬λ, which is shown with linear mapping.
. Surface densities (in NH2 cm−2) are limited in range with logarithmic color mapping, except for 𝒬λ, which is shown with linear mapping.
Current usage metrics show cumulative count of Article Views (full-text article views including HTML views, PDF and ePub downloads, according to the available data) and Abstracts Views on Vision4Press platform.
Data correspond to usage on the plateform after 2015. The current usage metrics is available 48-96 hours after online publication and is updated daily on week days.
Initial download of the metrics may take a while.