Fig. 13.
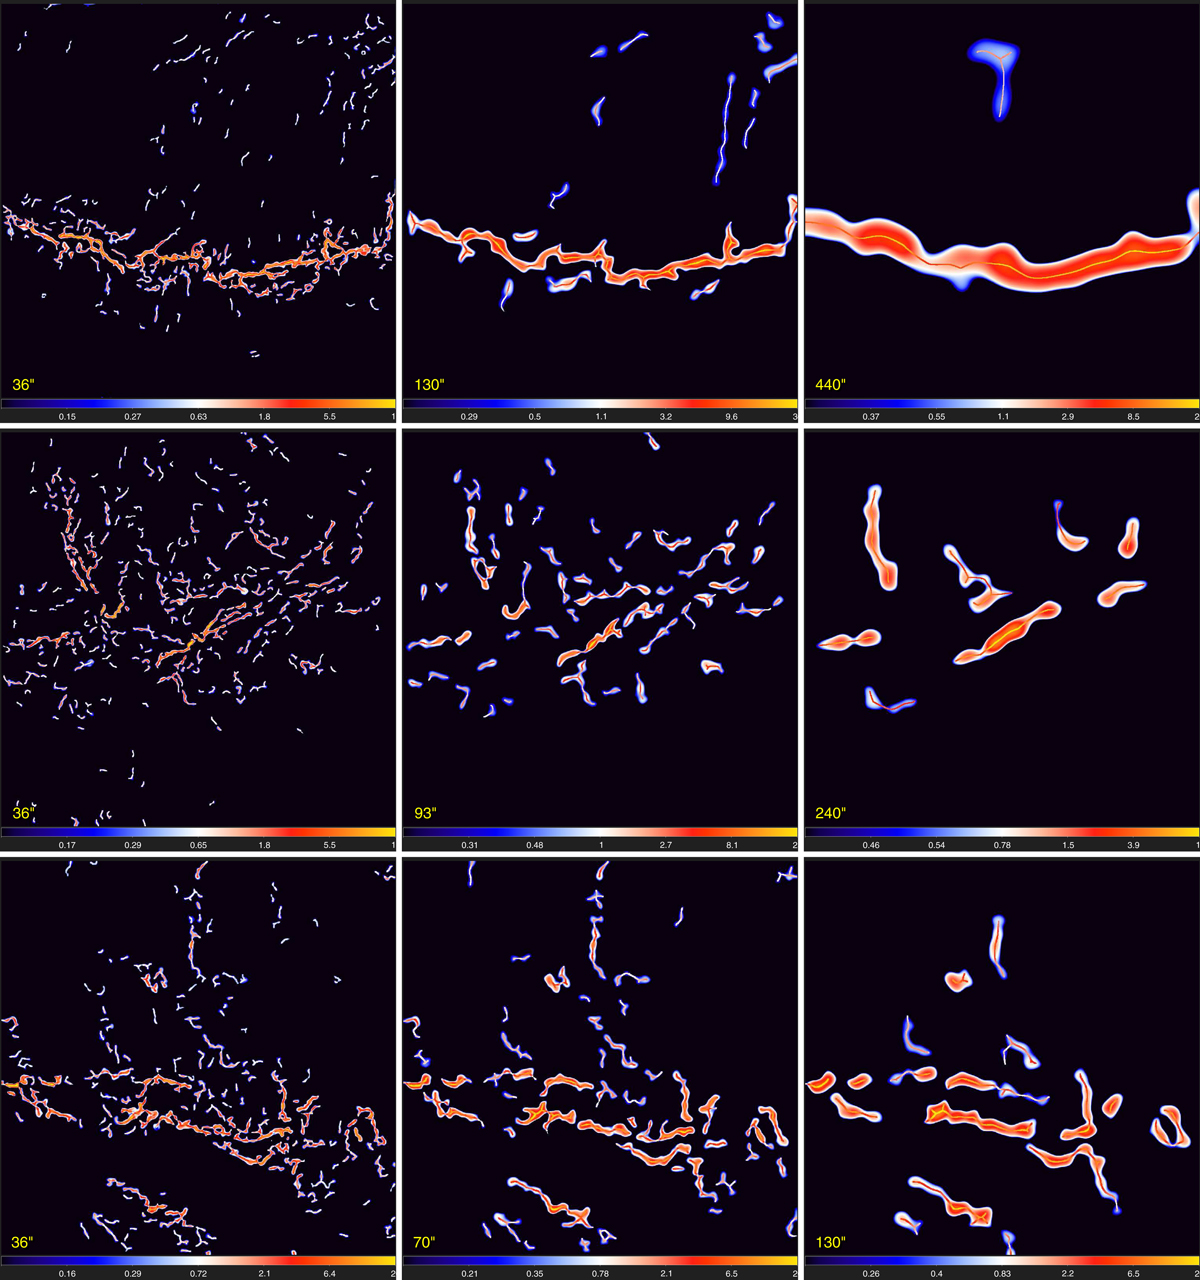
Filaments extracted by getsf on selected spatial scales in three star-forming regions: Taurus (top), Aquila (middle), and IC 5146 (bottom). The flattened components ℱƛD derived from the hires surface densities 𝒟13″ obtained from Eq. (8) using the Herschel 160, 250, 350, and 500 μm images are shown. The minimum scales of 36″ (left column) correspond to 2.8 times the angular resolution, whereas the maximum scales (right column) correspond to 0.3 pc at the adopted distances of the regions (140, 260, and 460 pc, respectively). Intermediate scales between the two extremes are displayed in the middle column. The images were cleaned using the default threshold ϖƛFj = 2σƛFj. Overlaid on the filaments are their skeletons obtained from the images using the Hilditch algorithm (Sect. 3.4.5). The observed filaments are heavily substructured, and their appearance, detected skeletons, and measured properties depend strongly on spatial scales. Logarithmic color mapping.
Current usage metrics show cumulative count of Article Views (full-text article views including HTML views, PDF and ePub downloads, according to the available data) and Abstracts Views on Vision4Press platform.
Data correspond to usage on the plateform after 2015. The current usage metrics is available 48-96 hours after online publication and is updated daily on week days.
Initial download of the metrics may take a while.