Fig. 12.
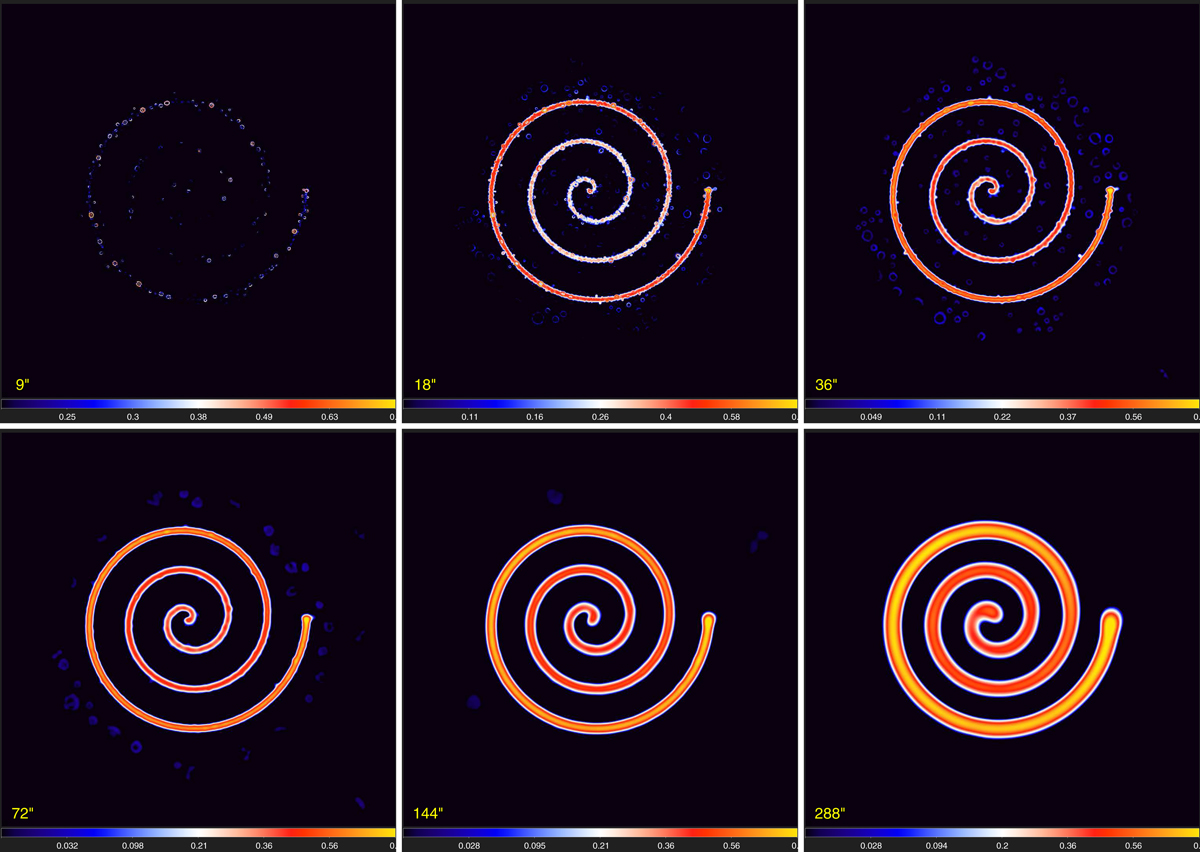
Combination of the detection images ℱƛDjC (Sect. 3.4.2) for the set of images ℐλ containing all Herschel wavebands and ℐƛ ≡ 𝒟13″ from Eq. (8). The clean ℱDjC thresholded above ϖλFj = 2σλFj and combined over five wavebands are shown (excluding the noisier 70 and 100 μm images). The faint ring-like structures that are visible on some scales are the source residuals originating from the derived surface densities that have substantial inaccuracies over the sources (cf. Figs. 5 and 8; Appendix A). Square-root color mapping.
Current usage metrics show cumulative count of Article Views (full-text article views including HTML views, PDF and ePub downloads, according to the available data) and Abstracts Views on Vision4Press platform.
Data correspond to usage on the plateform after 2015. The current usage metrics is available 48-96 hours after online publication and is updated daily on week days.
Initial download of the metrics may take a while.