Fig. 11.
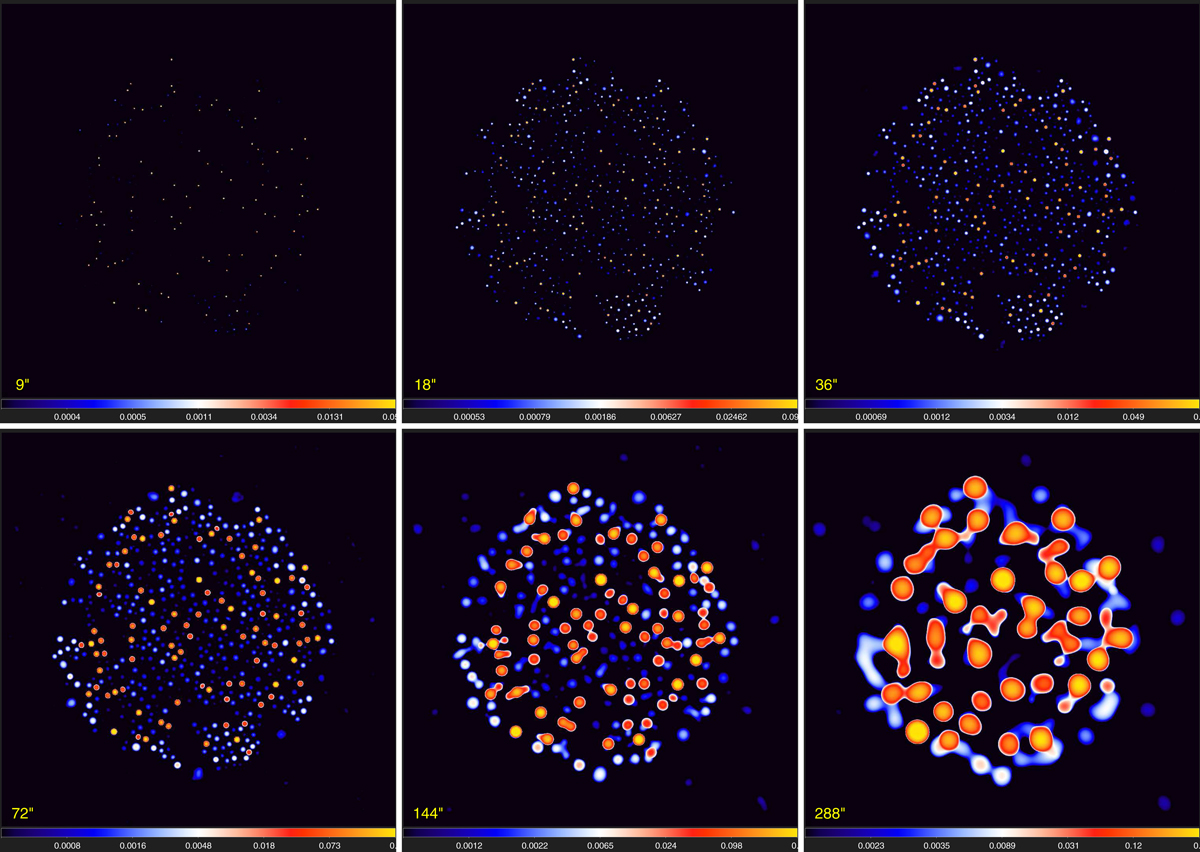
Combination of the detection images 𝒮λDjC (Sect. 3.4.2) for the set of images ℐλ containing all Herschel wavebands and ℐƛ ≡ 𝒟13″ from Eq. (8). The clean 𝒮DjC thresholded above ϖλSj = 5σλSj and combined over all wavebands are shown. Several faint spurious peaks visible on large scales near edges in the bottom row are the background and noise fluctuations that happened to be stronger than the threshold. They may be discarded during the subsequent detection and measurement steps. Logarithmic color mapping.
Current usage metrics show cumulative count of Article Views (full-text article views including HTML views, PDF and ePub downloads, according to the available data) and Abstracts Views on Vision4Press platform.
Data correspond to usage on the plateform after 2015. The current usage metrics is available 48-96 hours after online publication and is updated daily on week days.
Initial download of the metrics may take a while.