Fig. 2.
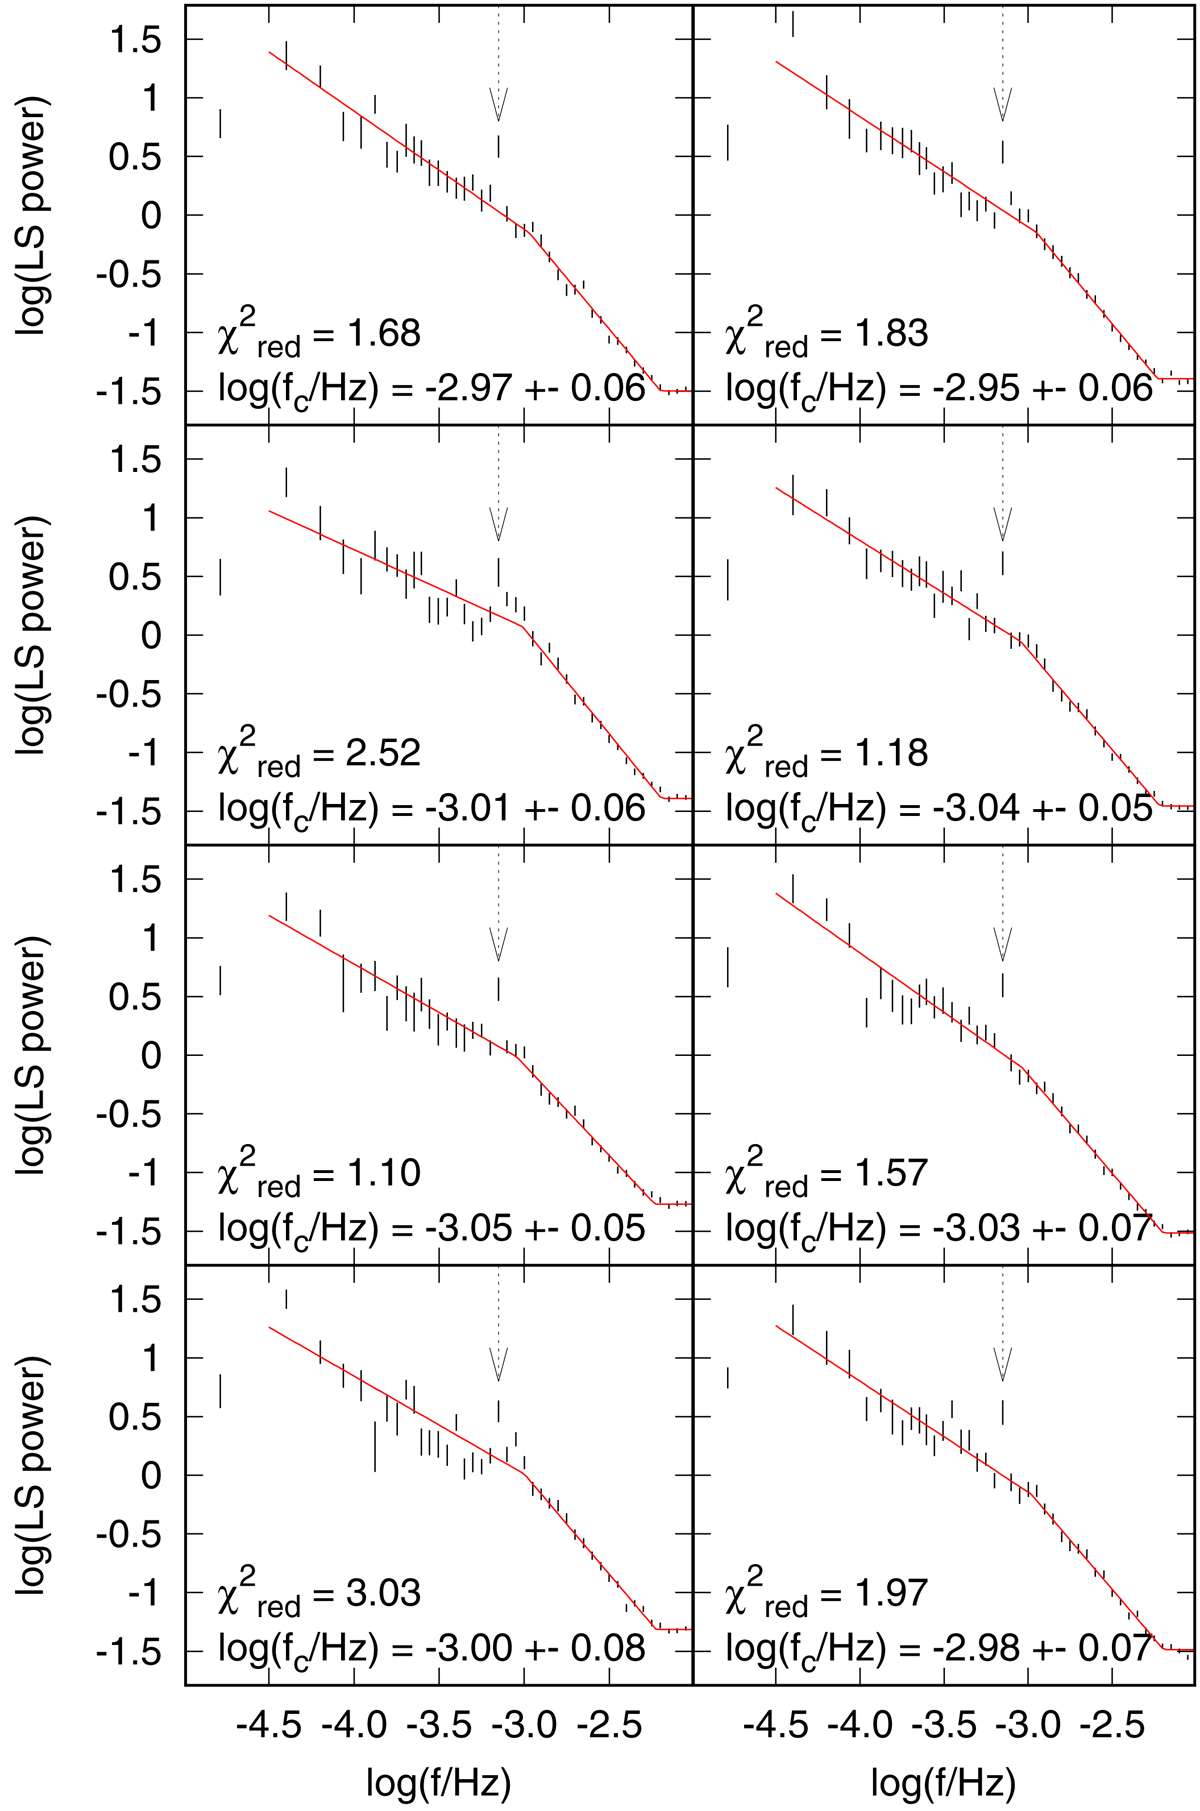
PDSs of V4743 Sgr with three component fits (red lines). Eight cases are shown because the light curve is divided into eight subsamples with a duration of 10 days. Each PDS point is displayed as a vertical line showing the uncertainty interval. The latter represents the standard error of the mean. The labels report the reduced χ2, indicating the goodness of the fits, and the characteristic break frequencies fc. The vertical dashed arrows show the frequency related to the WD spin period, which was excluded from the fitting process. The PDS point with the lowest frequency was not included in the fit because the considerably lower power is a result of detrending.
Current usage metrics show cumulative count of Article Views (full-text article views including HTML views, PDF and ePub downloads, according to the available data) and Abstracts Views on Vision4Press platform.
Data correspond to usage on the plateform after 2015. The current usage metrics is available 48-96 hours after online publication and is updated daily on week days.
Initial download of the metrics may take a while.