Fig. 7.
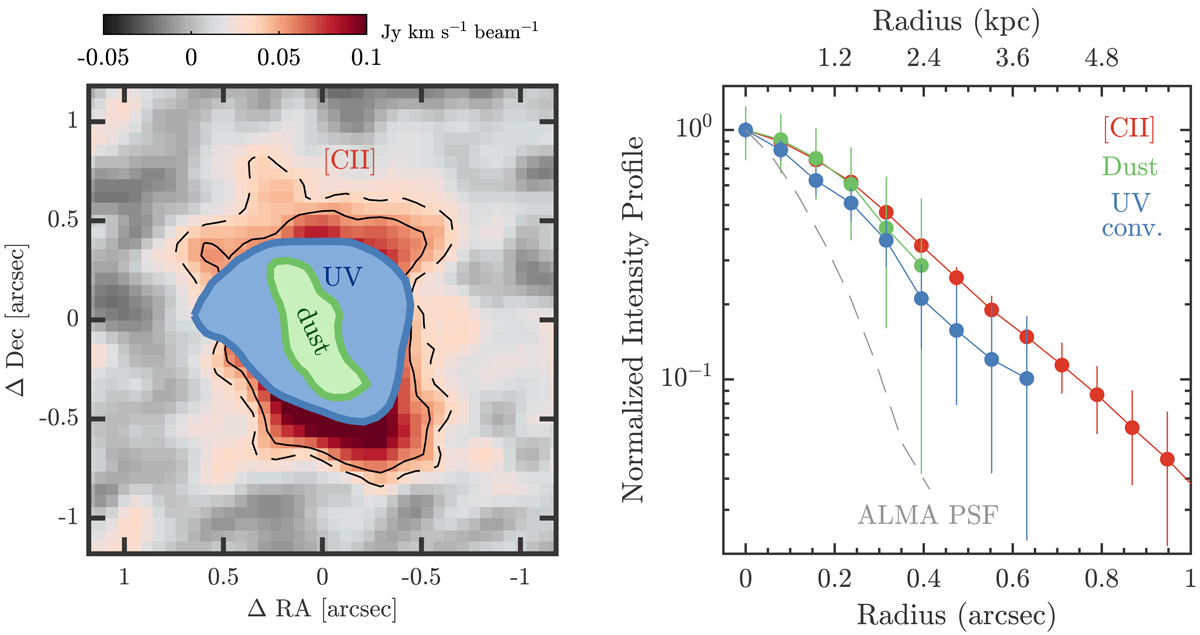
Left: integrated intensity map of the [C II] line emission. The extent of the dust and convolved rest-frame UV continuum emission with S/N > 3 is shown in green and blue, respectively. Right: normalized radial intensity profile for the [C II] line (red), dust continuum (green), and convolved rest-frame UV continuum emission (blue). The common ALMA beam intensity profile is shown with a dashed gray line. The distance from the center is shown in arcseconds (bottom) and projected kiloparsec (top, not corrected for inclination).
Current usage metrics show cumulative count of Article Views (full-text article views including HTML views, PDF and ePub downloads, according to the available data) and Abstracts Views on Vision4Press platform.
Data correspond to usage on the plateform after 2015. The current usage metrics is available 48-96 hours after online publication and is updated daily on week days.
Initial download of the metrics may take a while.