Fig. 5.
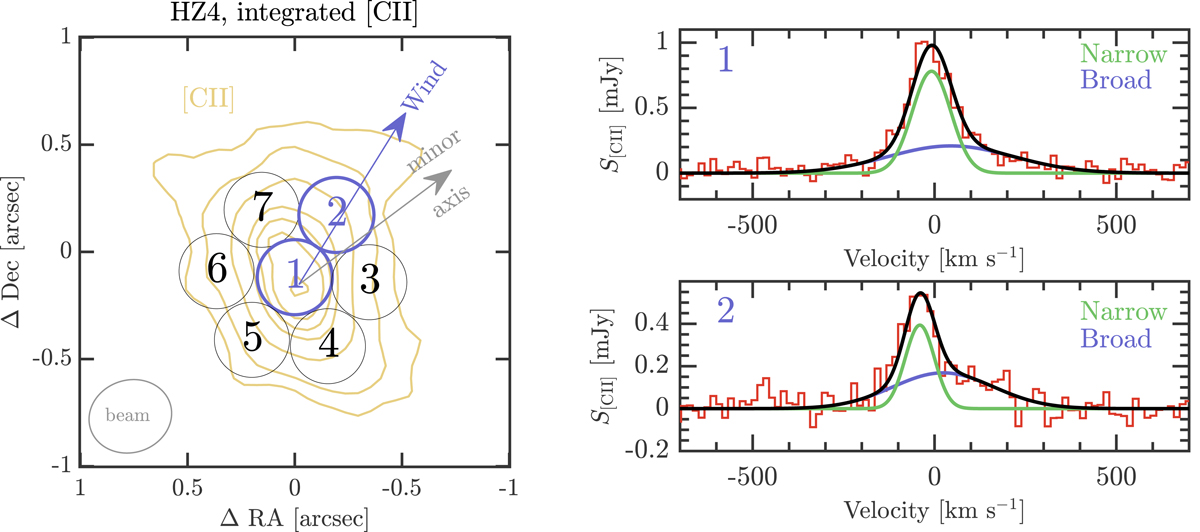
Evidence for an outflow in HZ4. Left panel: [C II] line integrated intensity contours with S/N ≥ 3 (yellow). The spectra extracted from the seven apertures placed across the disk are shown in Appendix B, except for apertures 1 and 2 (in purple), for which the spectra are shown in the right panels. In these cases, the best Gaussian fit to the spectra involves two components: a narrow component that we associate with the disk (green), and a broad component that we associate with outflowing gas (purple). The purple arrow in the [C II] map shows the direction in the disk were we find evidence for outflowing gas, which is almost along the galaxy minor axis (gray arrow).
Current usage metrics show cumulative count of Article Views (full-text article views including HTML views, PDF and ePub downloads, according to the available data) and Abstracts Views on Vision4Press platform.
Data correspond to usage on the plateform after 2015. The current usage metrics is available 48-96 hours after online publication and is updated daily on week days.
Initial download of the metrics may take a while.