Fig. 4.
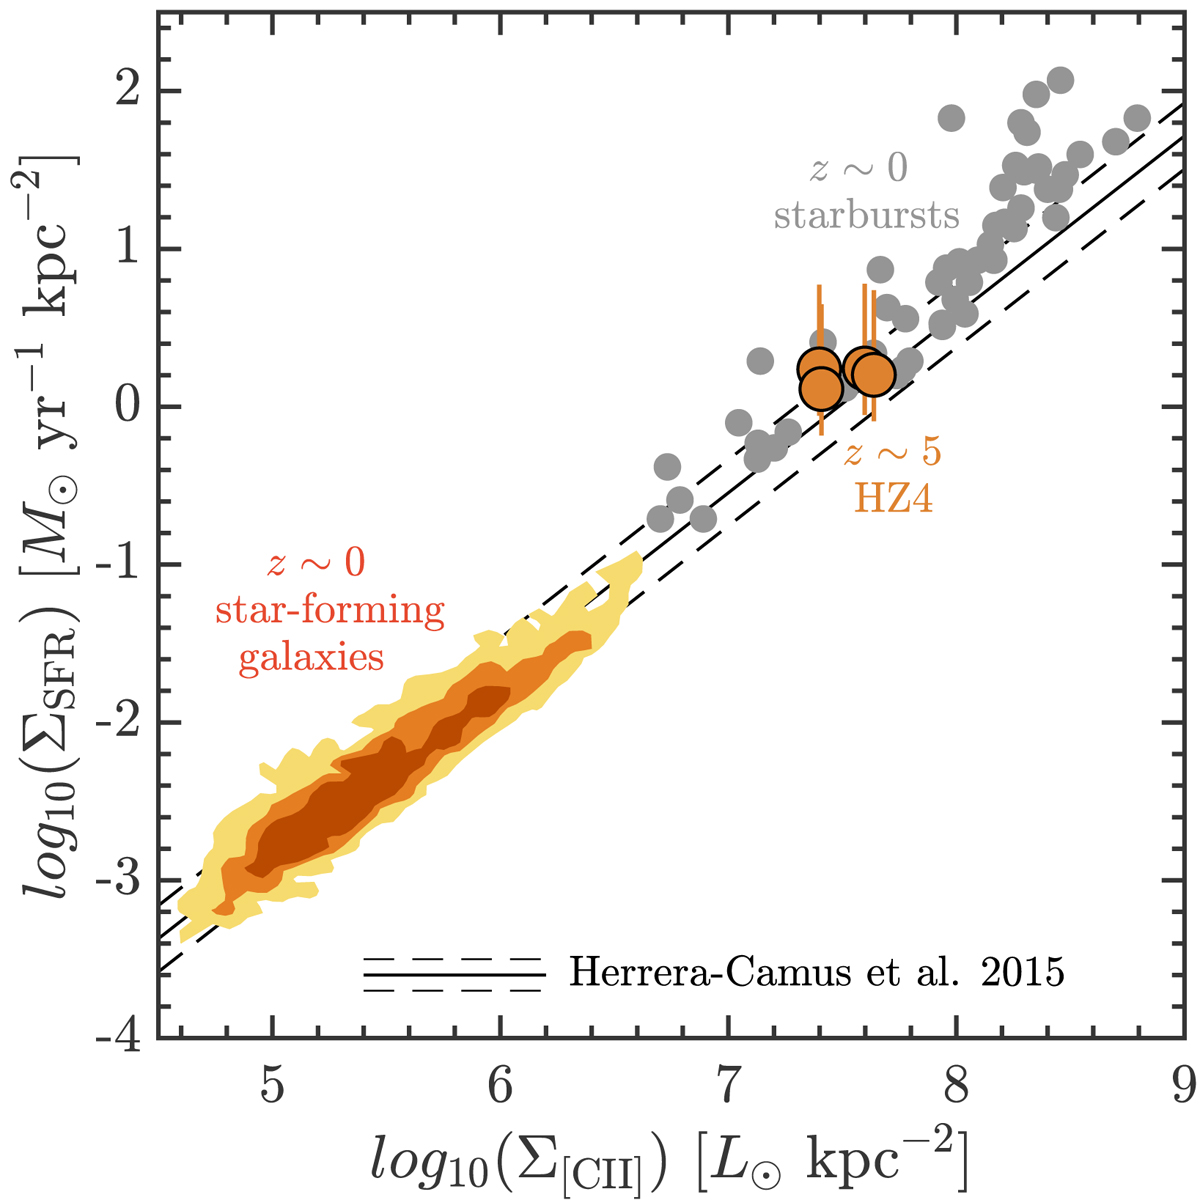
[C II] surface brightness density vs. star formation rate surface density observed in regions from star-forming nearby galaxies from the KINGFISH sample (contours enclose 95%, 45%, and 25% of the 3846 regions; Herrera-Camus et al. 2015), nearby starbursts from the SHINING sample (gray circles; Herrera-Camus et al. 2018a), and the four regions in HZ4 in which we detect the dust continuum with ALMA (orange circles). The black line shows the best fit (and ±1σ scatter) to the KINGFISH regions (Herrera-Camus et al. 2015).
Current usage metrics show cumulative count of Article Views (full-text article views including HTML views, PDF and ePub downloads, according to the available data) and Abstracts Views on Vision4Press platform.
Data correspond to usage on the plateform after 2015. The current usage metrics is available 48-96 hours after online publication and is updated daily on week days.
Initial download of the metrics may take a while.