Fig. 3.
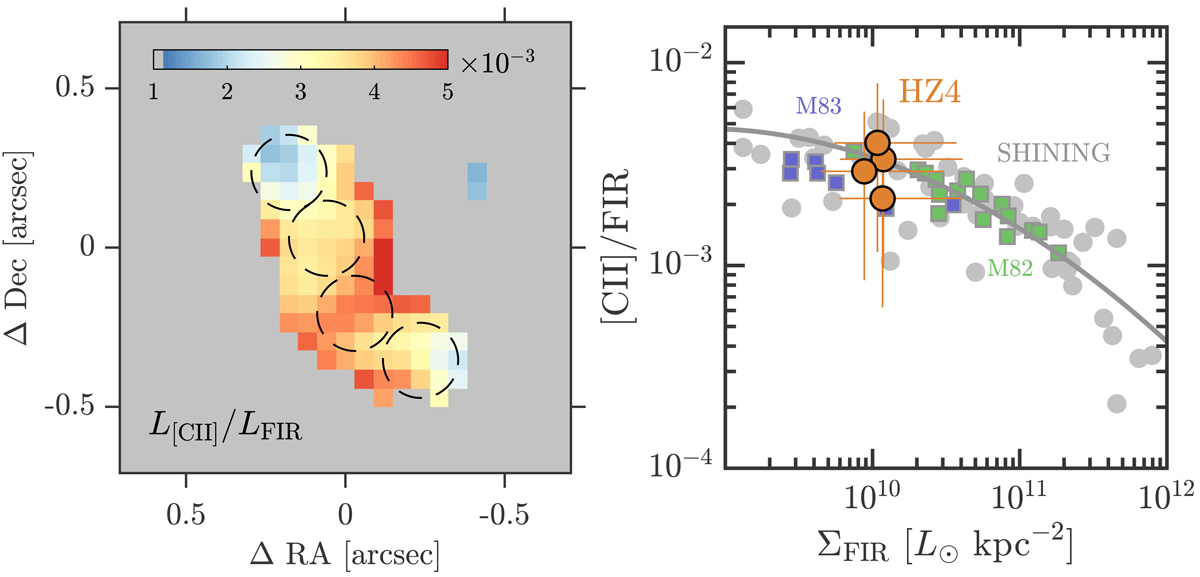
Left: [C II]/FIR map of HZ4. We have considered only rest-frame ∼160 μm dust continuum emission above the 2σ level. The color bar indicates the [C II]/FIR value. Right: [C II]/FIR ratio as a function of ΣFIR in four kiloparsec-size regions extracted across the disk of HZ4 (orange circles and dashed black circles in the left panel). The error bars, mainly due to the uncertainty in the FIR luminosity, are shown in orange. For comparison, we show nearby star-forming and starburst galaxies from the SHINING sample (Herrera-Camus et al. 2018a), ∼100 pc scale regions in the central disk of M 82 in green (Contursi et al. 2013; Herrera-Camus et al. 2018a), and ∼400 pc scale regions in the central region of M 83 in purple. The solid gray line shows the best quadratic fit to the SHINING data (Herrera-Camus et al. 2018a).
Current usage metrics show cumulative count of Article Views (full-text article views including HTML views, PDF and ePub downloads, according to the available data) and Abstracts Views on Vision4Press platform.
Data correspond to usage on the plateform after 2015. The current usage metrics is available 48-96 hours after online publication and is updated daily on week days.
Initial download of the metrics may take a while.