Fig. 2.
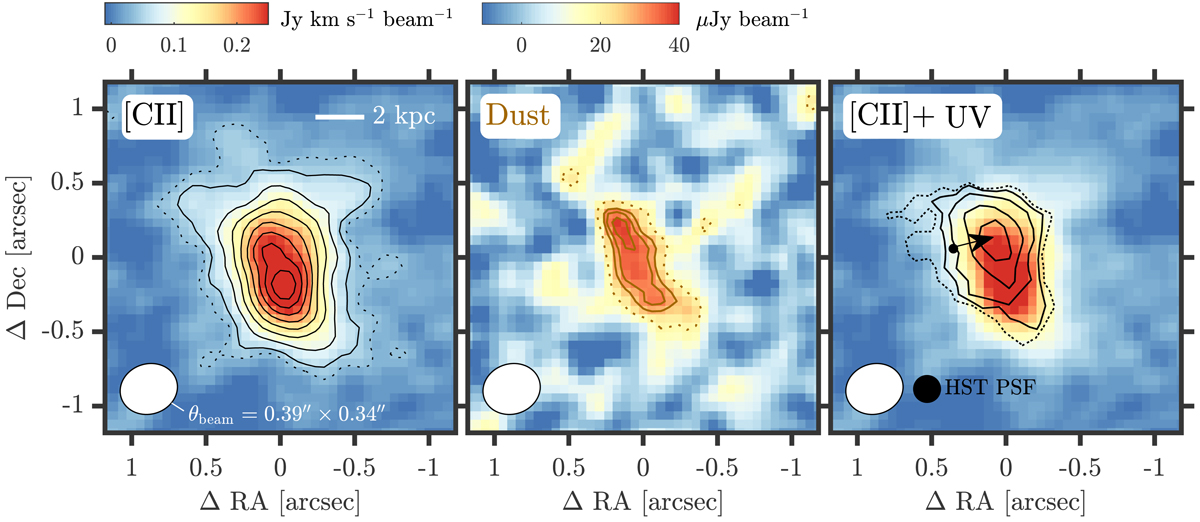
Left: [C II] 158 μm integrated intensity of HZ4. The contours start at 2σ (dotted line) and then increase from 3σ to 17σ in steps of two (solid lines). The ALMA-synthesized beam (θ = 0.39″ × 0.34″) is shown in the bottom left corner. Center: dust continuum emission at rest-frame 160 μm. The contours level are 2 (dotted brown line), and 3, 3.5, and 4σ (solid brown lines). Right: contours of rest-frame UV emission as observed by HST WFC3 F160W (Barisic et al. 2017) overlaid on the [C II] integrated intensity map. The contour levels are 2 (dashed black line), 3, 5, 10, and 20σ (solid black lines). The contours are shifted in the direction of the black arrow from the original position marked by the black dot. The HST WFC3 F160W point-spread function is shown in black in the bottom left corner next to the ALMA beam in white.
Current usage metrics show cumulative count of Article Views (full-text article views including HTML views, PDF and ePub downloads, according to the available data) and Abstracts Views on Vision4Press platform.
Data correspond to usage on the plateform after 2015. The current usage metrics is available 48-96 hours after online publication and is updated daily on week days.
Initial download of the metrics may take a while.