Free Access
Fig. C.1.
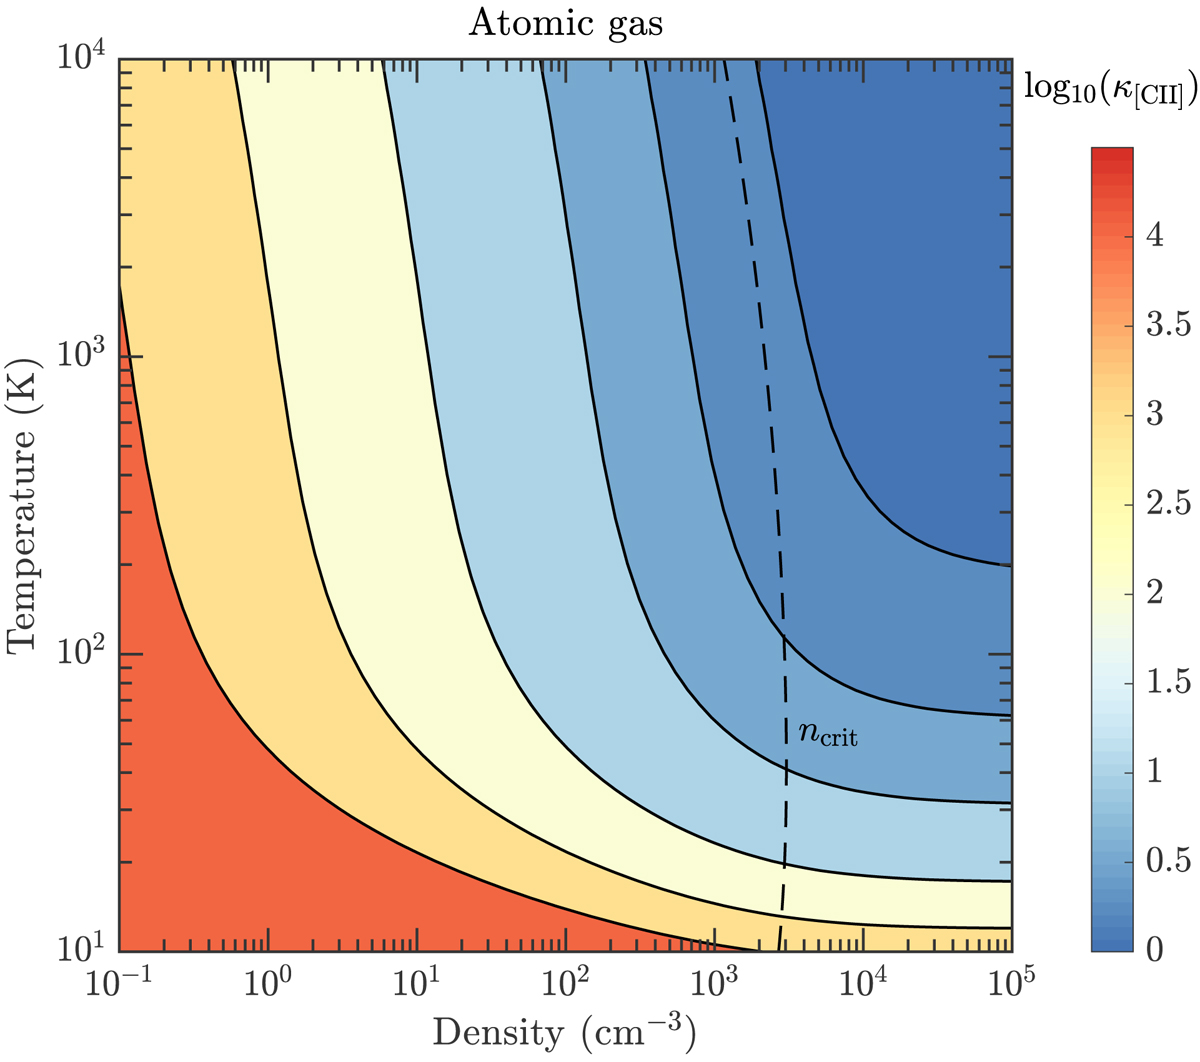
κ[CII](H0) as a function of neutral gas density n and temperature T. The value of the critical density as a function of T from Goldsmith et al. (2015) is shown as a dashed black line. The black contours represent ![]() .
.
Current usage metrics show cumulative count of Article Views (full-text article views including HTML views, PDF and ePub downloads, according to the available data) and Abstracts Views on Vision4Press platform.
Data correspond to usage on the plateform after 2015. The current usage metrics is available 48-96 hours after online publication and is updated daily on week days.
Initial download of the metrics may take a while.