Fig. 4.
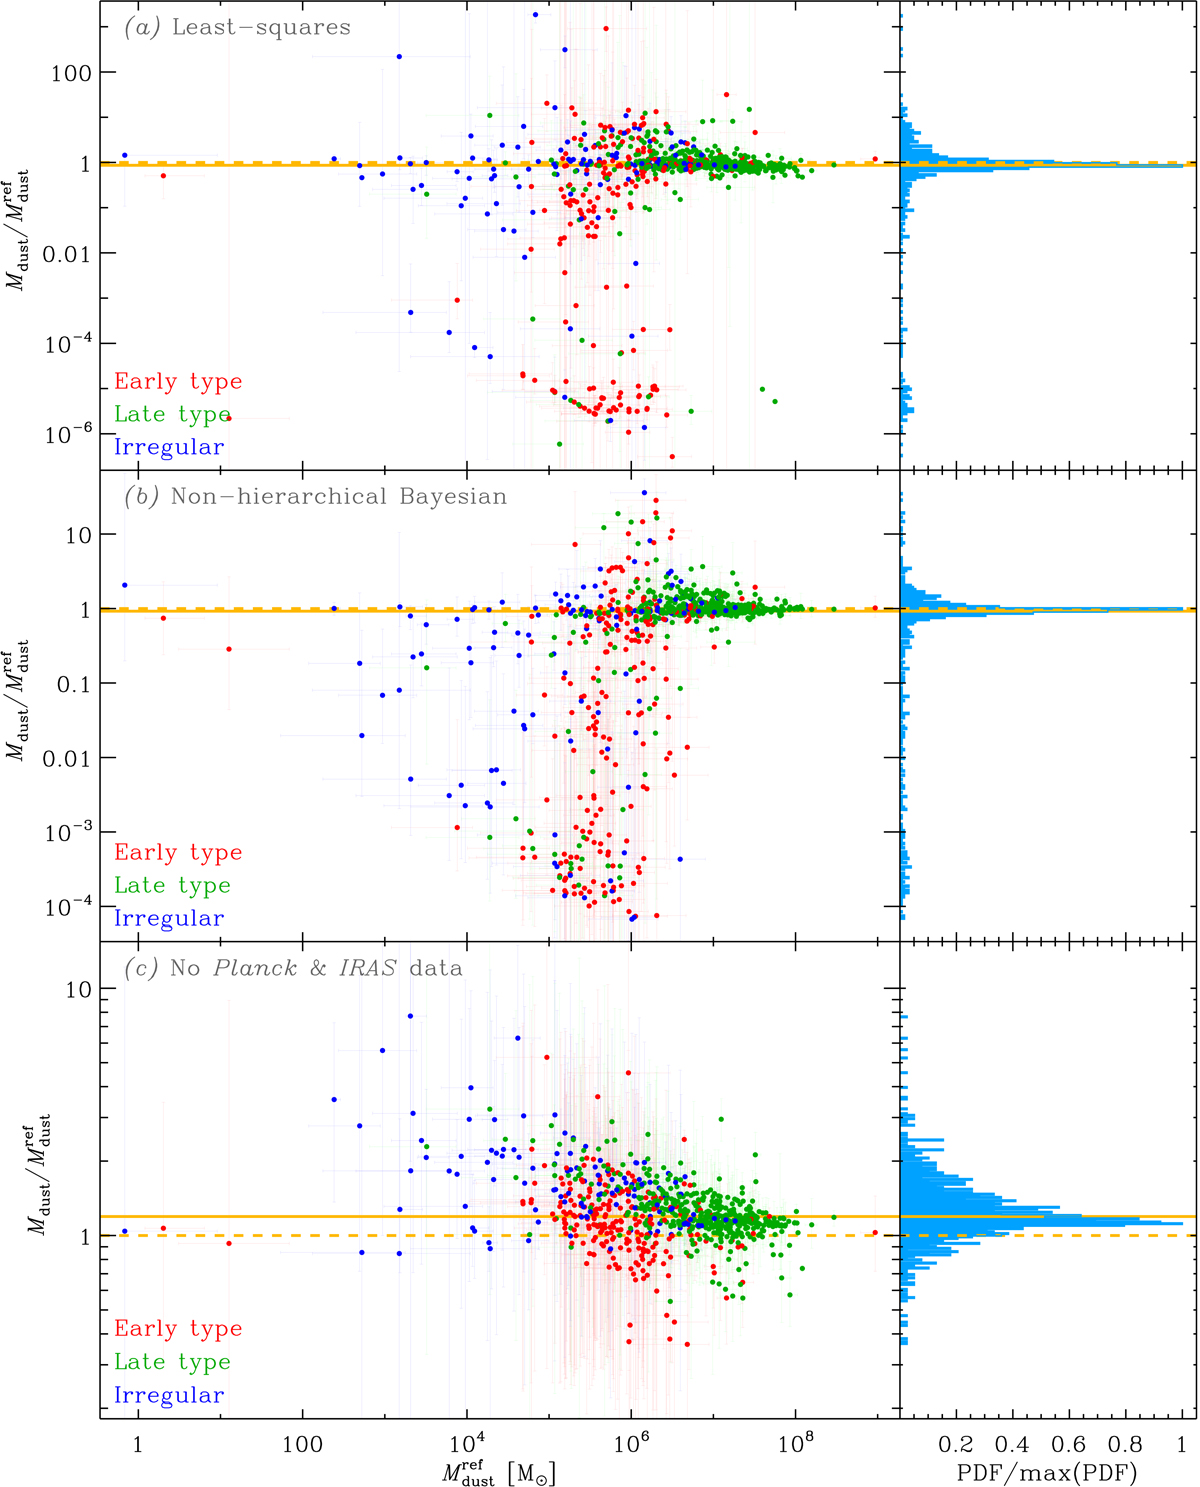
Robustness assessment. Each of the three horizontal panels of Figs. 4–6 display the comparison of the various tests of Sect. 3.3 to our reference run (Sect. 3.2). Left column panels: ratio of either Mdust or qPAH, derived from the test (gray label in the top left corner), to its equivalent with the reference run, as a function of ![]() . Galaxies are color-coded according to their type. Right column plot: PDF (normalized) of the distribution of the ratio. The median of the ratio is displayed as an orange solid line. The 1:1 ratio is highlighted as an orange dashed line. This figure shows the influence of various fitting methods.
. Galaxies are color-coded according to their type. Right column plot: PDF (normalized) of the distribution of the ratio. The median of the ratio is displayed as an orange solid line. The 1:1 ratio is highlighted as an orange dashed line. This figure shows the influence of various fitting methods.
Current usage metrics show cumulative count of Article Views (full-text article views including HTML views, PDF and ePub downloads, according to the available data) and Abstracts Views on Vision4Press platform.
Data correspond to usage on the plateform after 2015. The current usage metrics is available 48-96 hours after online publication and is updated daily on week days.
Initial download of the metrics may take a while.