Fig. 3.
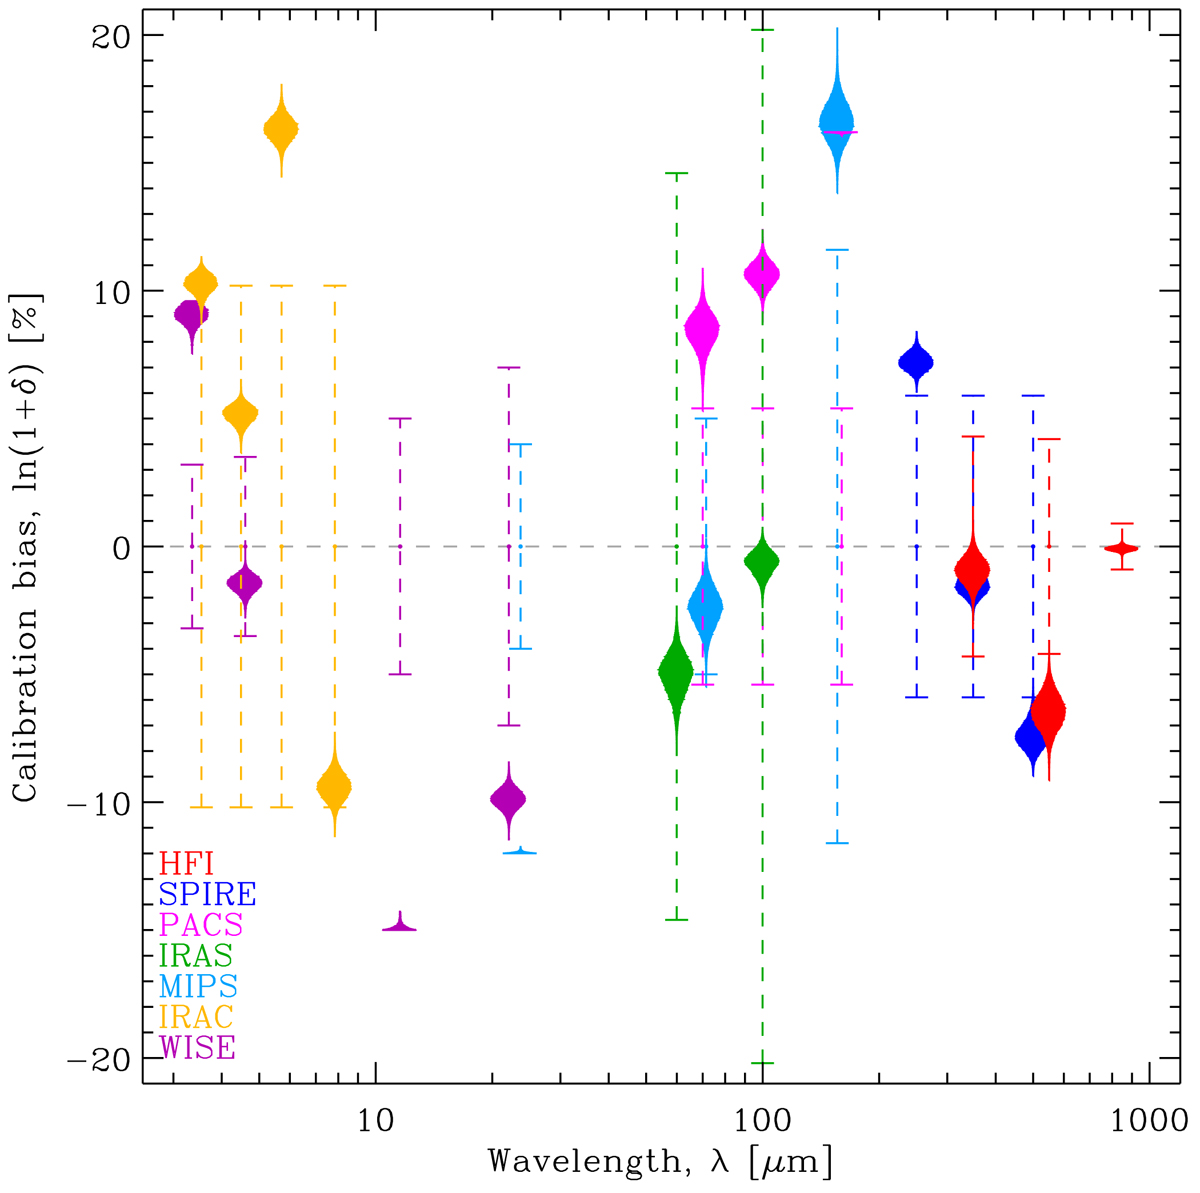
Inferred calibration biases. This figure shows our inference of the calibration bias, δ, defined in Sect. 3.2.2 of G18, for each of the photometric filters in Table 1. Each instrument is color-coded. The vertical dashed error bars represent the calibration prior, that is the ±1σ range given in Appendix A. The violin plots show the actual posterior PDFs of δ, for each broadband. The width of a single violin plot is proportional to the PDF as a function of δ (vertical axis).
Current usage metrics show cumulative count of Article Views (full-text article views including HTML views, PDF and ePub downloads, according to the available data) and Abstracts Views on Vision4Press platform.
Data correspond to usage on the plateform after 2015. The current usage metrics is available 48-96 hours after online publication and is updated daily on week days.
Initial download of the metrics may take a while.