Fig. F.1.
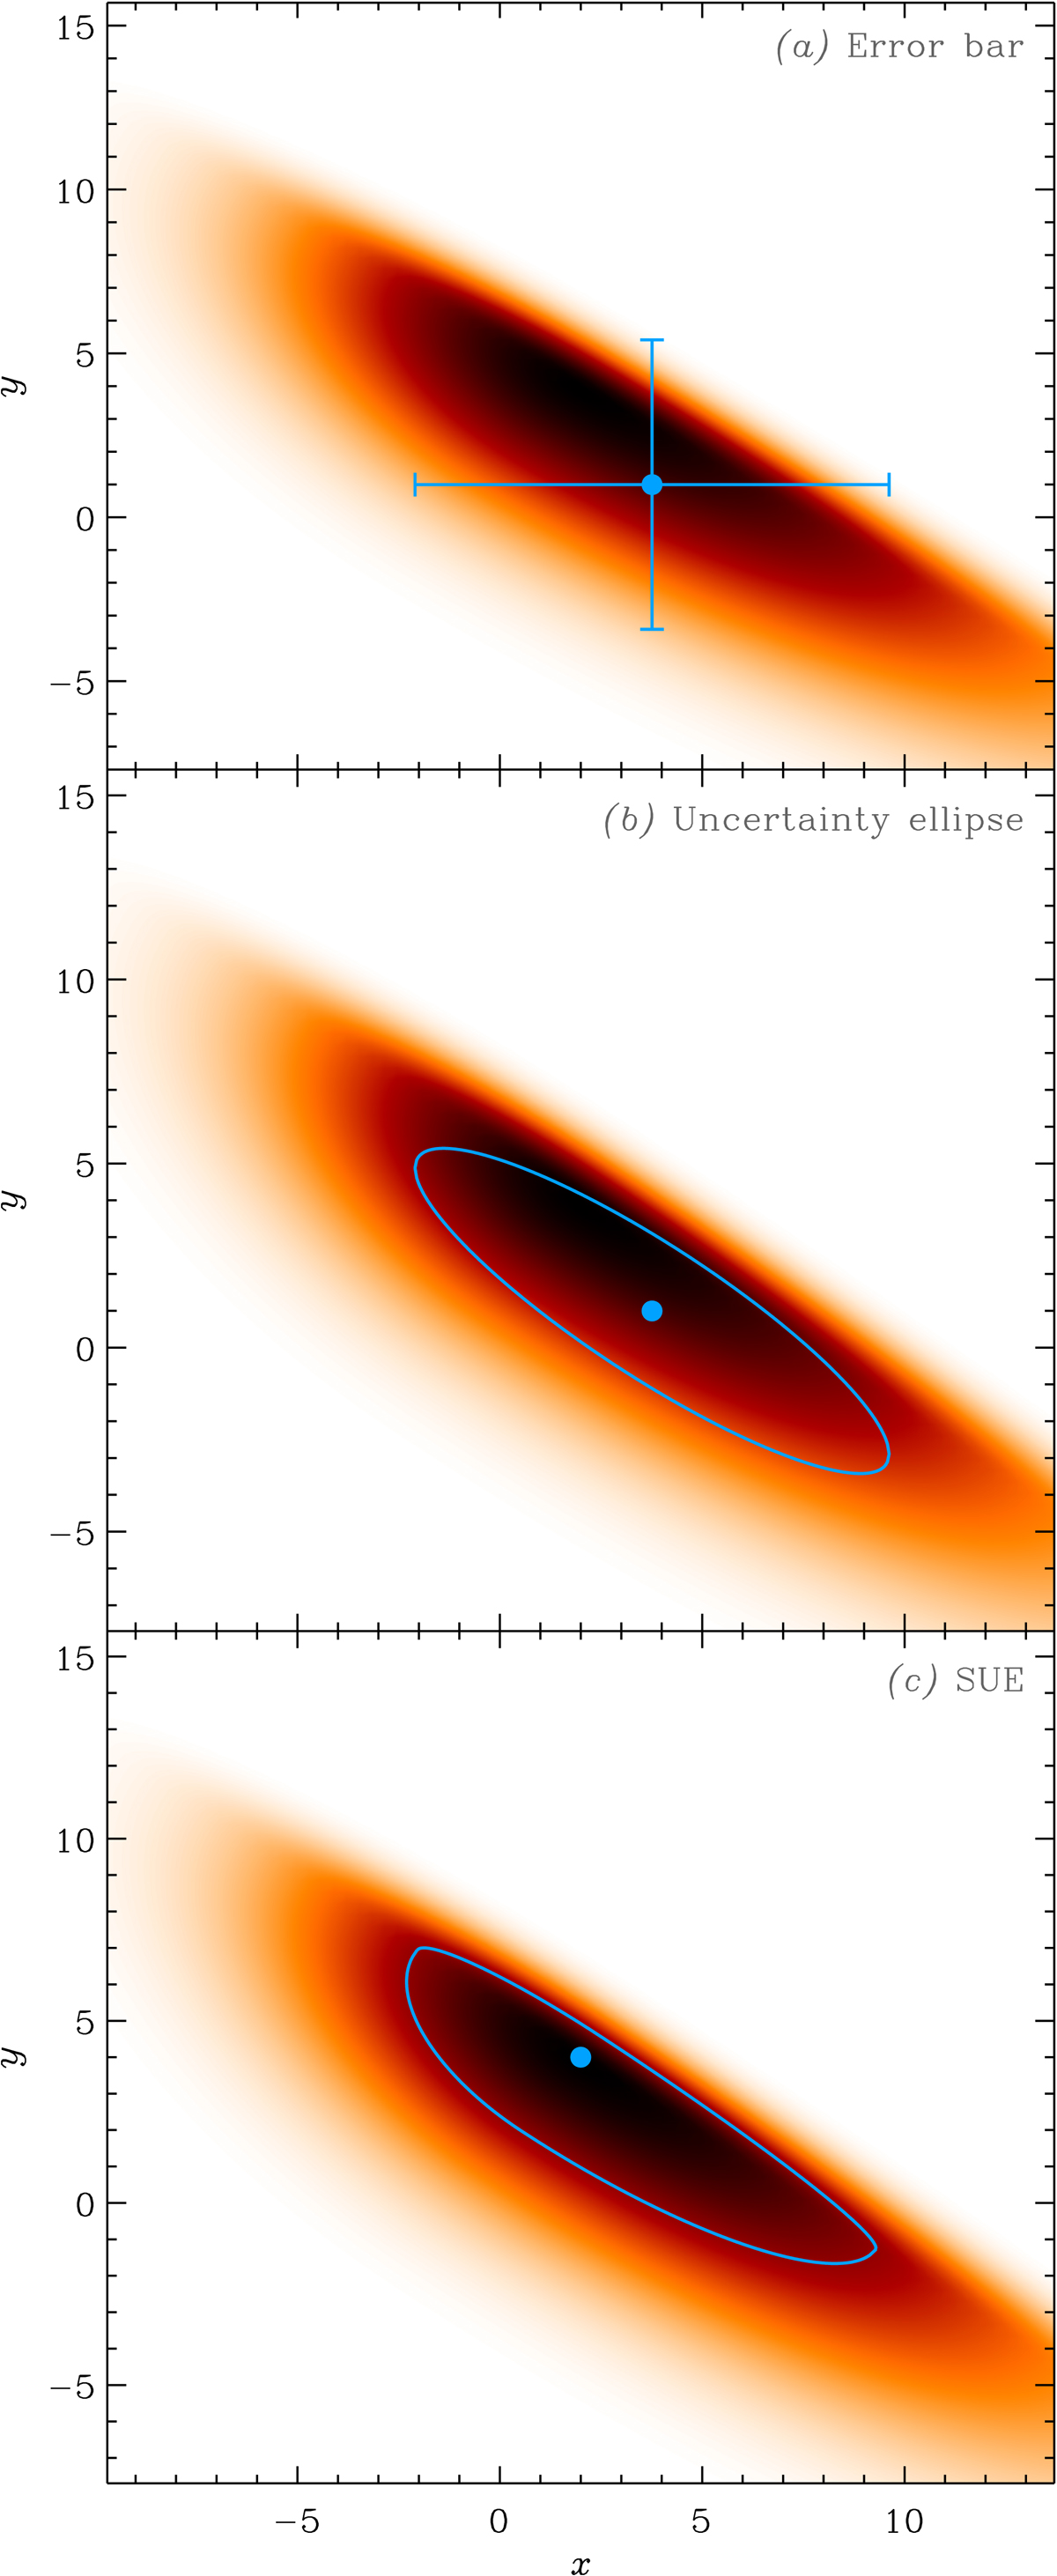
Uncertainty display. The orange density contours in the three panels represent an arbitrary bivariate PDF of two variables x and y. Panel a: corresponding traditional error bar: the dot is the mean and the bars show the ±1σ extent along both axes. Panel b: widely-used uncertainty ellipse, which can be viewed as the mode and 1σ contour of a bivariate normal distribution having the same means, standard-deviations and correlation coefficient as the PDF. Panel c: concept of SUE introduced in Appendix F.1.
Current usage metrics show cumulative count of Article Views (full-text article views including HTML views, PDF and ePub downloads, according to the available data) and Abstracts Views on Vision4Press platform.
Data correspond to usage on the plateform after 2015. The current usage metrics is available 48-96 hours after online publication and is updated daily on week days.
Initial download of the metrics may take a while.