Fig. C.1.
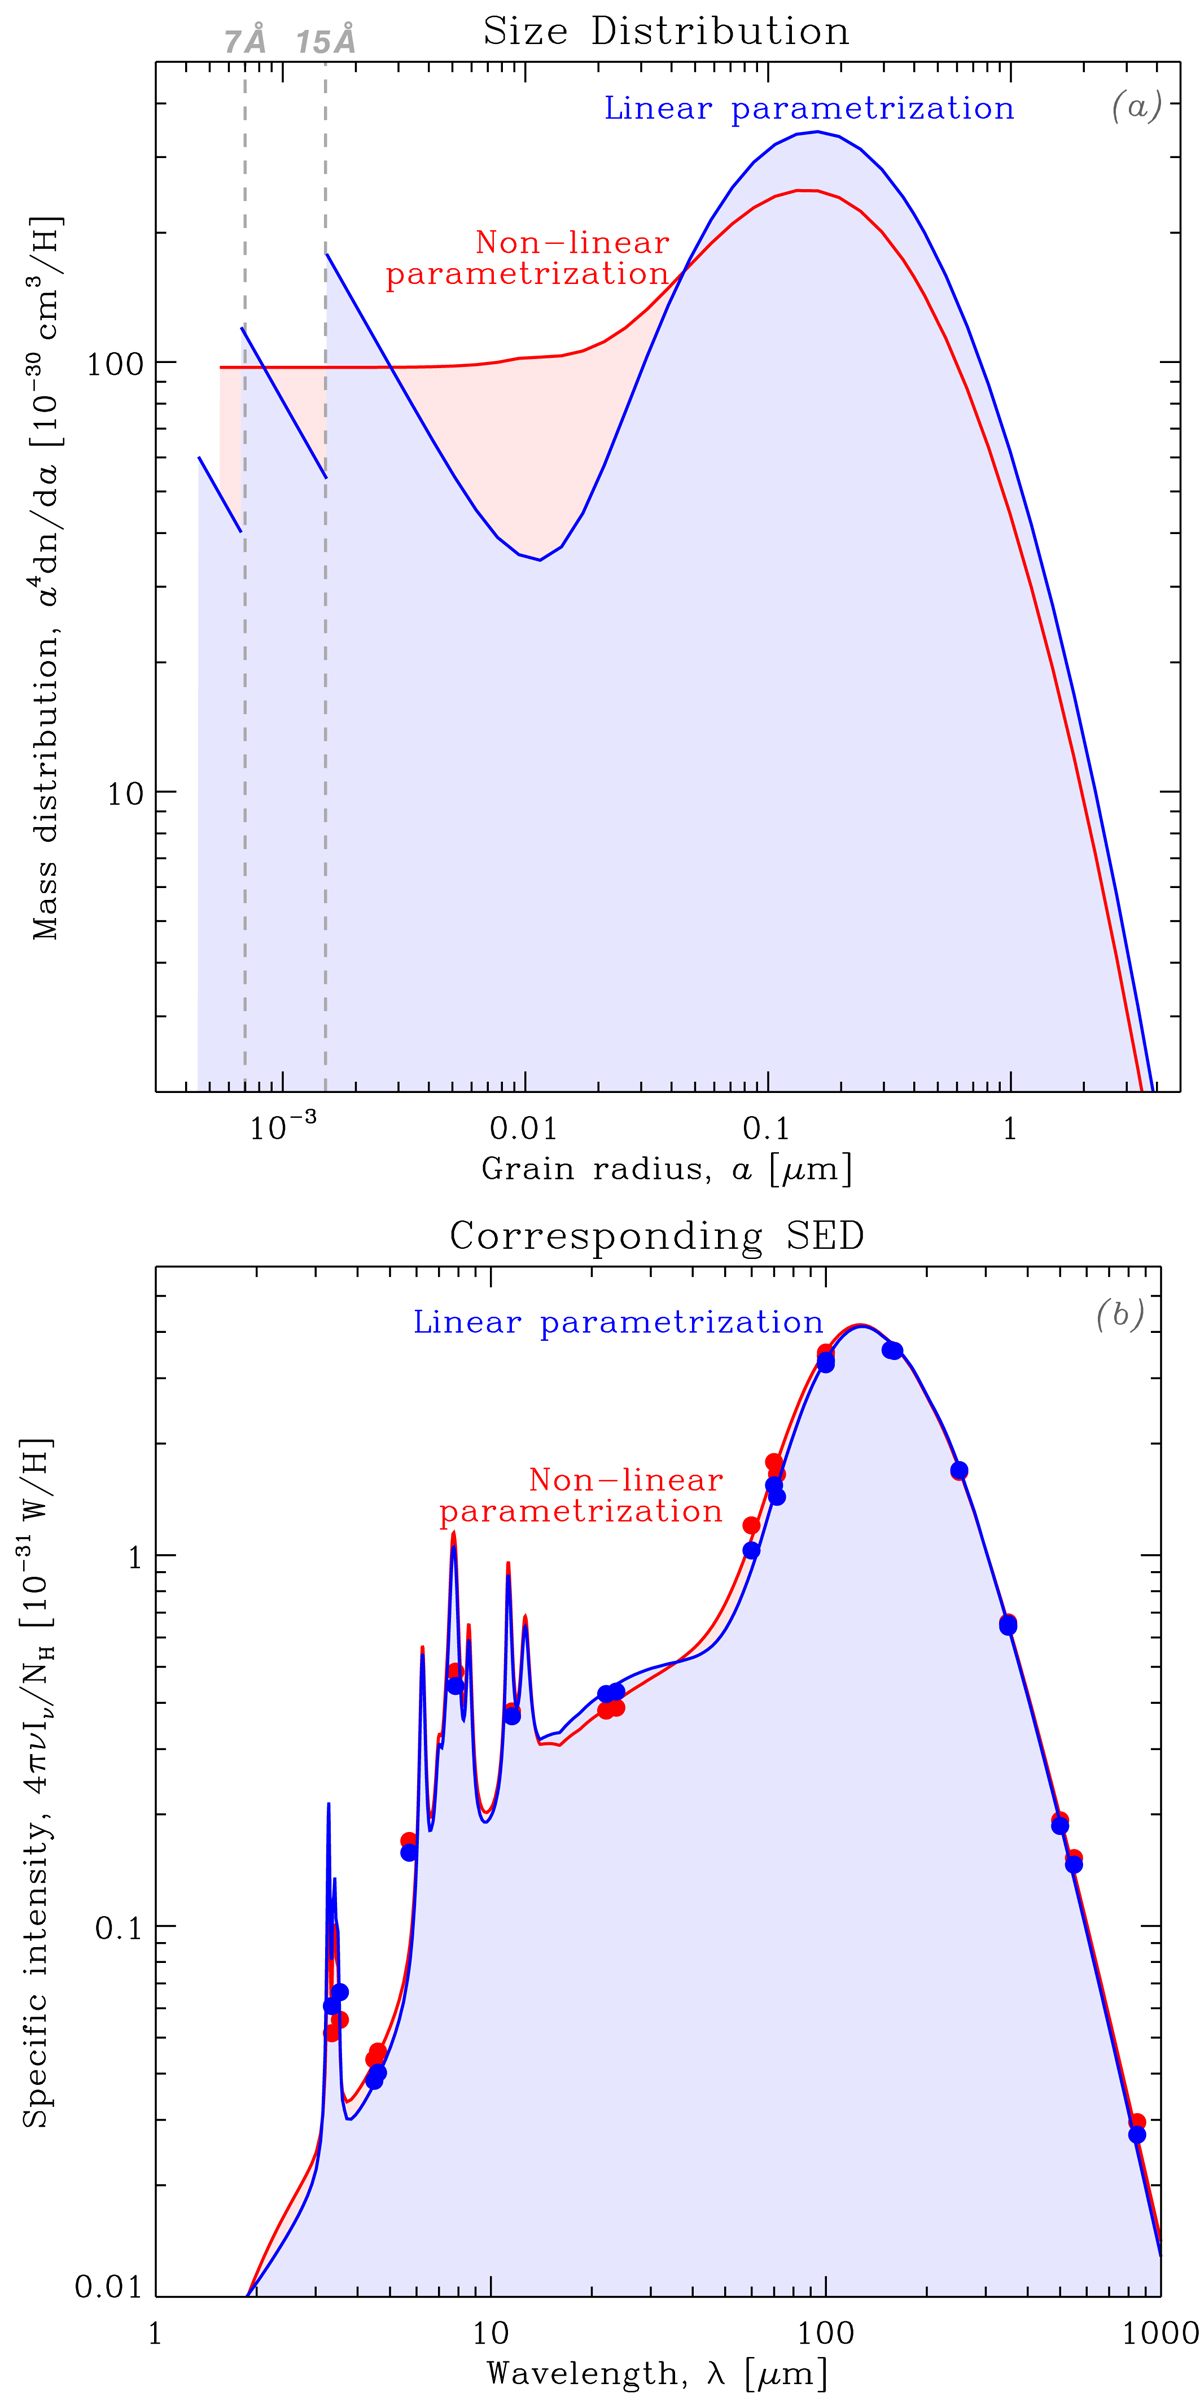
THEMIS parametrization comparison. The two panels display the same quantities as Fig. 1. On each panel, the red curve shows THEMIS, nonlinearly parametrized, that is varying the minimum cut-off radius, amin, and the index of the power-law1 size distribution, α. The blue curve shows THEMIS, linearly parametrized, with the method described in Sect. 3.1.1. The dots on the two SED curves (panel b) represent the synthetic photometry, that is the model integrated in the filters of Table 1.
Current usage metrics show cumulative count of Article Views (full-text article views including HTML views, PDF and ePub downloads, according to the available data) and Abstracts Views on Vision4Press platform.
Data correspond to usage on the plateform after 2015. The current usage metrics is available 48-96 hours after online publication and is updated daily on week days.
Initial download of the metrics may take a while.