Fig. B.2.
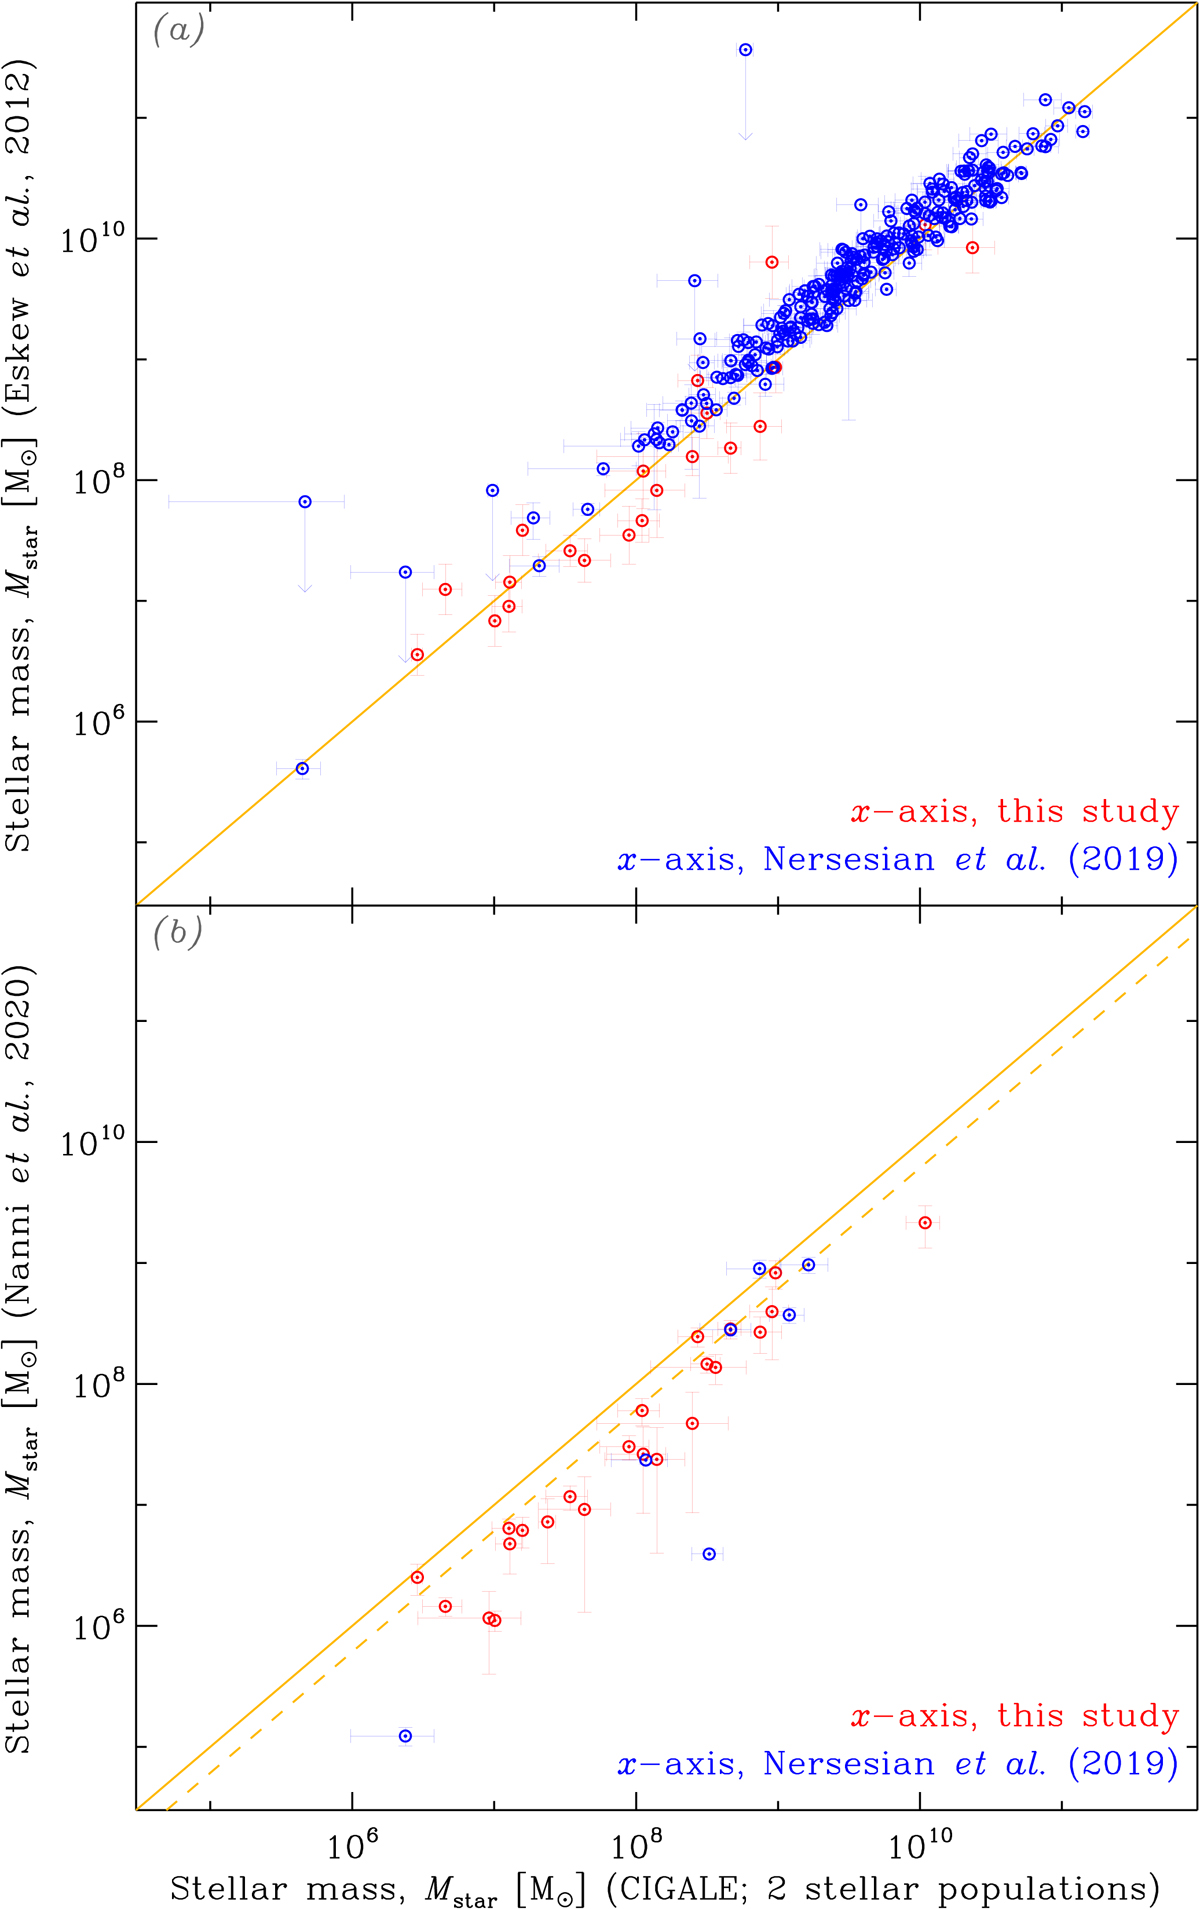
Comparison of stellar mass estimators. Panel a: compares the CIGALE estimates of M⋆, using two stellar populations (x-axis), with the Eskew et al. (2012, y-axis) empirical approximation, both assuming a Salpeter (1955) IMF. Panel b: compares the same x-axis as panel a to the CIGALE estimates, using a single stellar population and a Chabrier (2003) IMF, by N20. In both panels, the blue symbols correspond to the values presented in Nersesian et al. (2019), and the red symbols correspond to the values estimated for this study, with the same CIGALE settings. The solid yellow line represents the 1:1 relation. The dashed yellow line in panel b represents the 1:0.61 relation that accounts for the difference in IMFs.
Current usage metrics show cumulative count of Article Views (full-text article views including HTML views, PDF and ePub downloads, according to the available data) and Abstracts Views on Vision4Press platform.
Data correspond to usage on the plateform after 2015. The current usage metrics is available 48-96 hours after online publication and is updated daily on week days.
Initial download of the metrics may take a while.