Fig. 2.
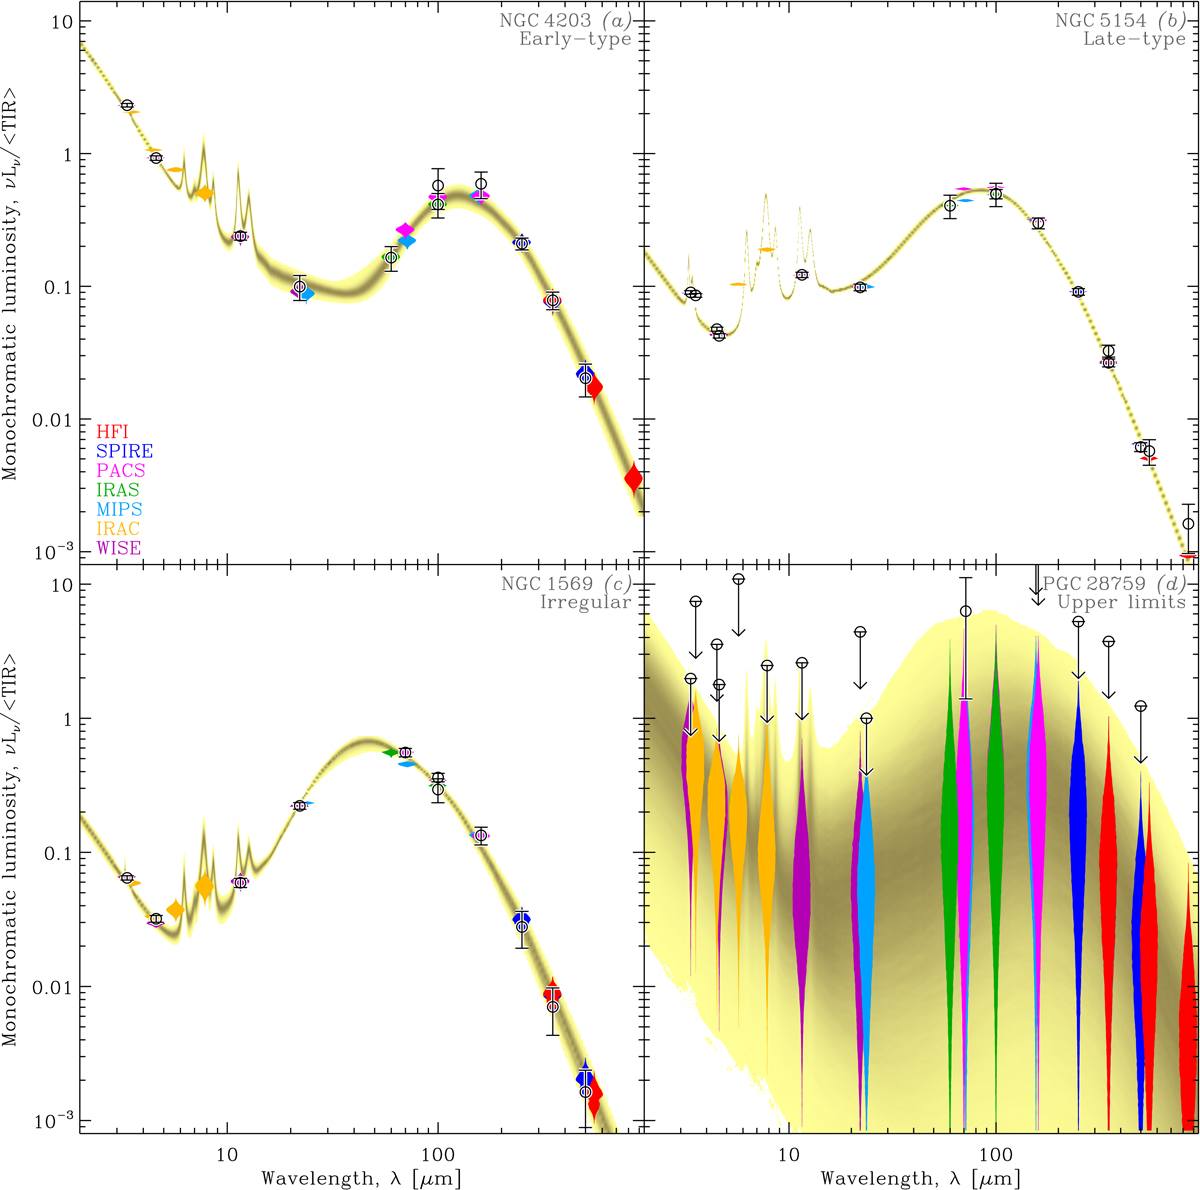
Select SED fits. Each panel shows the inferred SED PDF, in yellow intensity scale, normalized by the MCMC-averaged TIR. The color violin plots represent the synthetic photometry PDF, for each waveband. The black error bars are the observations. Panels a–c: arbitrary chosen galaxies, representative of their classes (early-type, late-type, and irregulars, respectively). Panel d: case, where most constraints are only upper limits.
Current usage metrics show cumulative count of Article Views (full-text article views including HTML views, PDF and ePub downloads, according to the available data) and Abstracts Views on Vision4Press platform.
Data correspond to usage on the plateform after 2015. The current usage metrics is available 48-96 hours after online publication and is updated daily on week days.
Initial download of the metrics may take a while.