Fig. B.1.
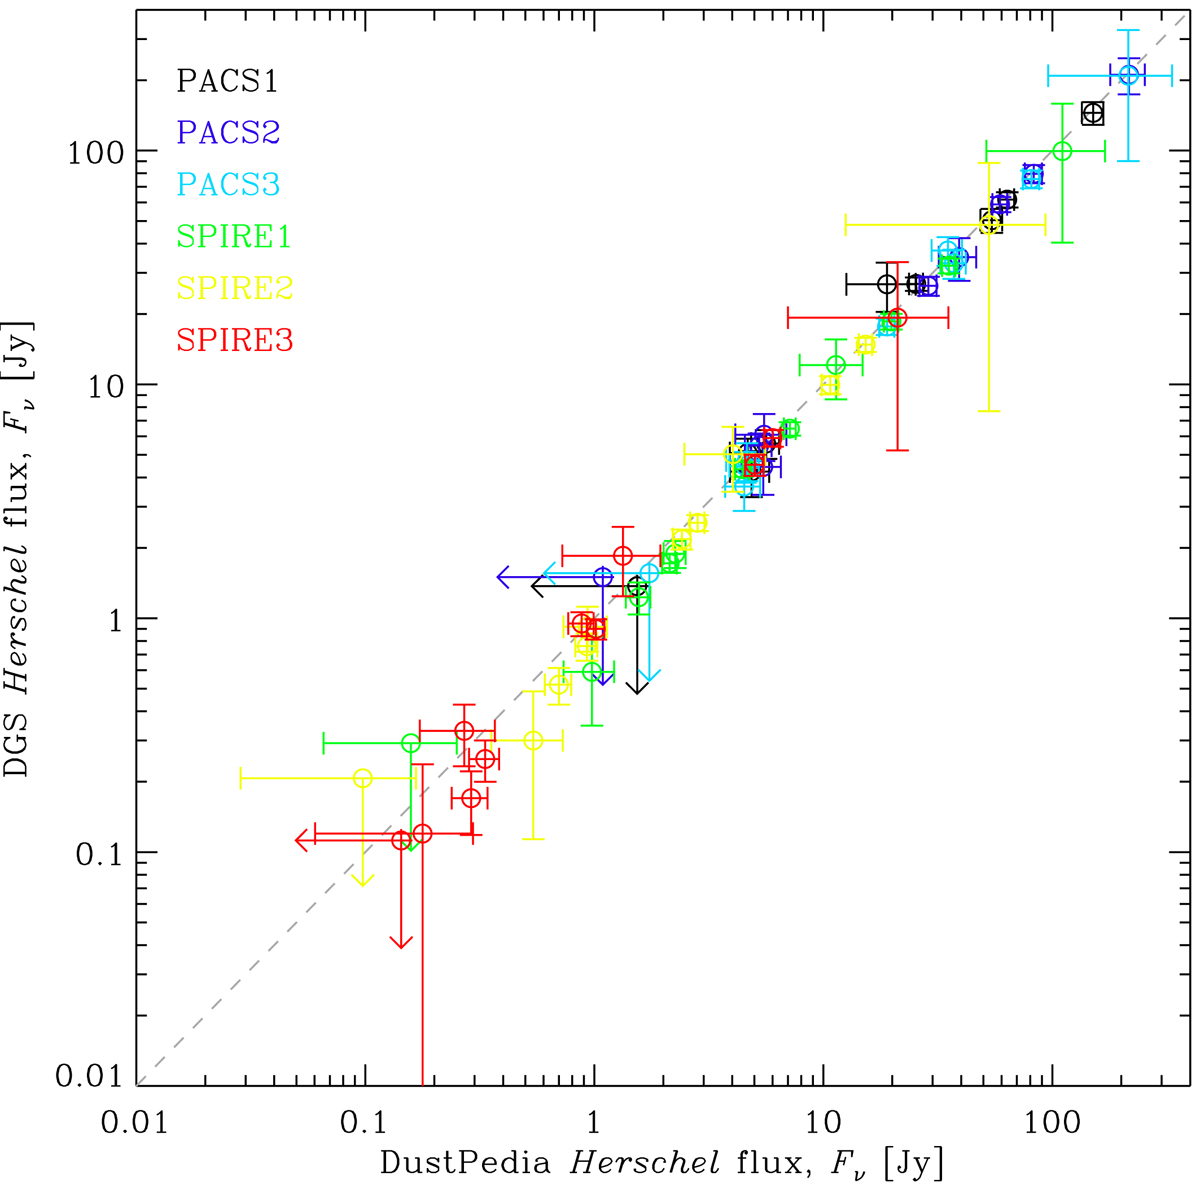
Comparison between the DustPedia and DGS photometry. The 13 sources of the DGS which are part of the DustPedia catalog are compared in the three PACS and three SPIRE bands (one color per filter). The x axis shows the photometry estimated by C18, while the y axis shows the photometry estimated by Rémy-Ruyer et al. (2015). The dashed line represents the 1:1 relation.
Current usage metrics show cumulative count of Article Views (full-text article views including HTML views, PDF and ePub downloads, according to the available data) and Abstracts Views on Vision4Press platform.
Data correspond to usage on the plateform after 2015. The current usage metrics is available 48-96 hours after online publication and is updated daily on week days.
Initial download of the metrics may take a while.