Fig. 16.
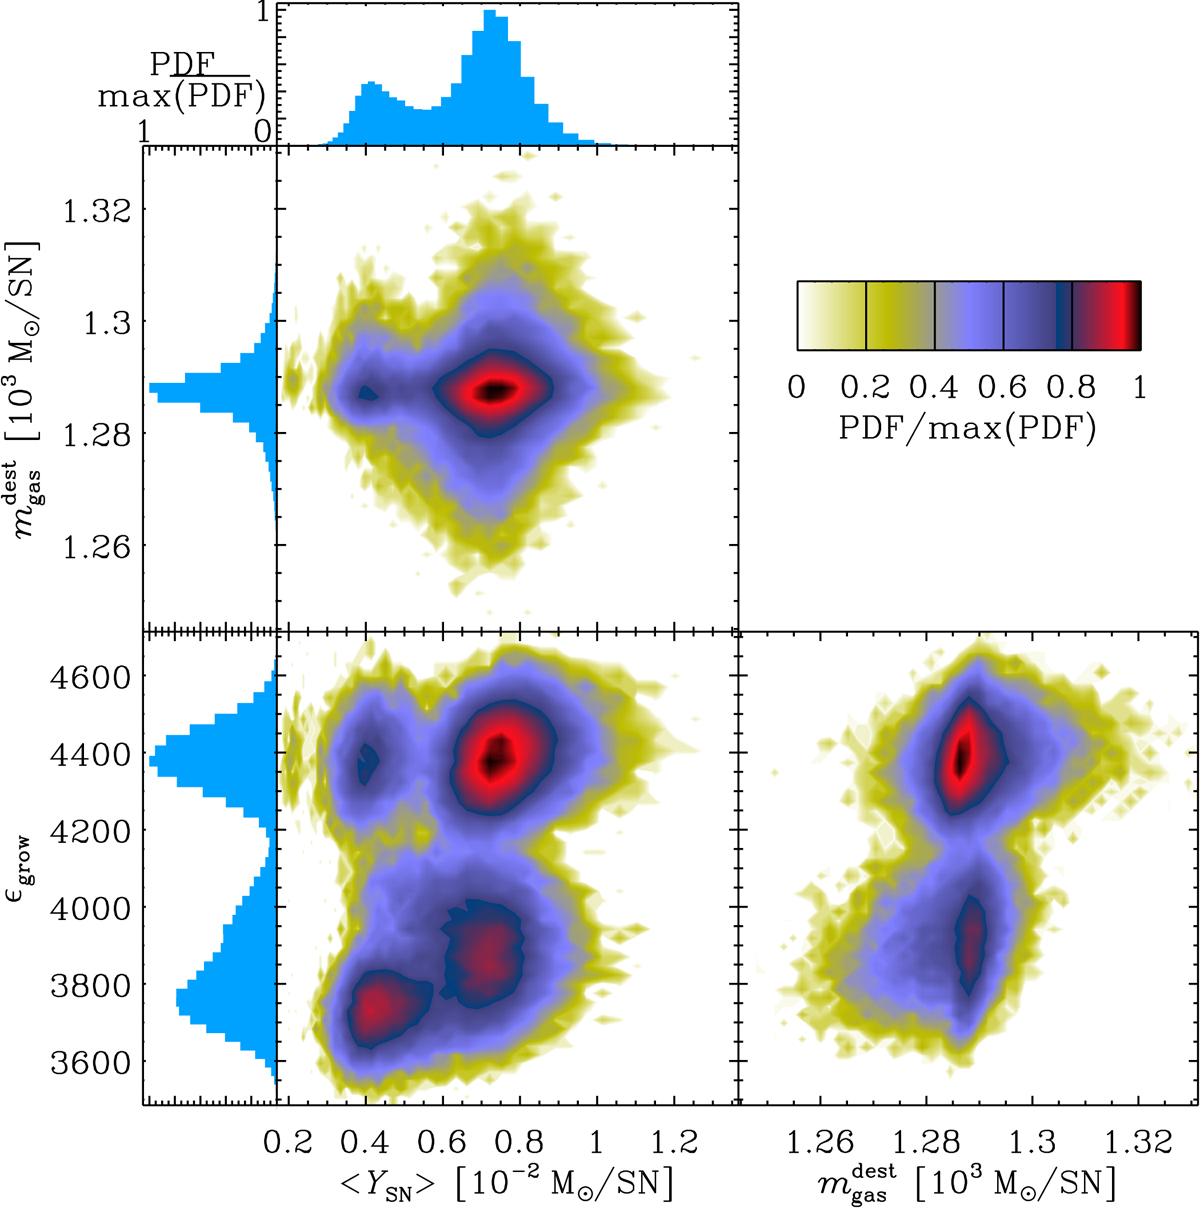
Posterior distribution of the tuning parameters, assuming a Salpeter (1955) IMF. The three central panels with colored contours display the bidimensional posterior PDF of pairs of parameters, marginalizing over all the other ones. The three margin plots show the posterior PDF of each tuning parameter. The PDFs are scaled (divided by their maximum). The displayed ranges encompass every single parameter draw after burn-in.
Current usage metrics show cumulative count of Article Views (full-text article views including HTML views, PDF and ePub downloads, according to the available data) and Abstracts Views on Vision4Press platform.
Data correspond to usage on the plateform after 2015. The current usage metrics is available 48-96 hours after online publication and is updated daily on week days.
Initial download of the metrics may take a while.