Fig. 15.
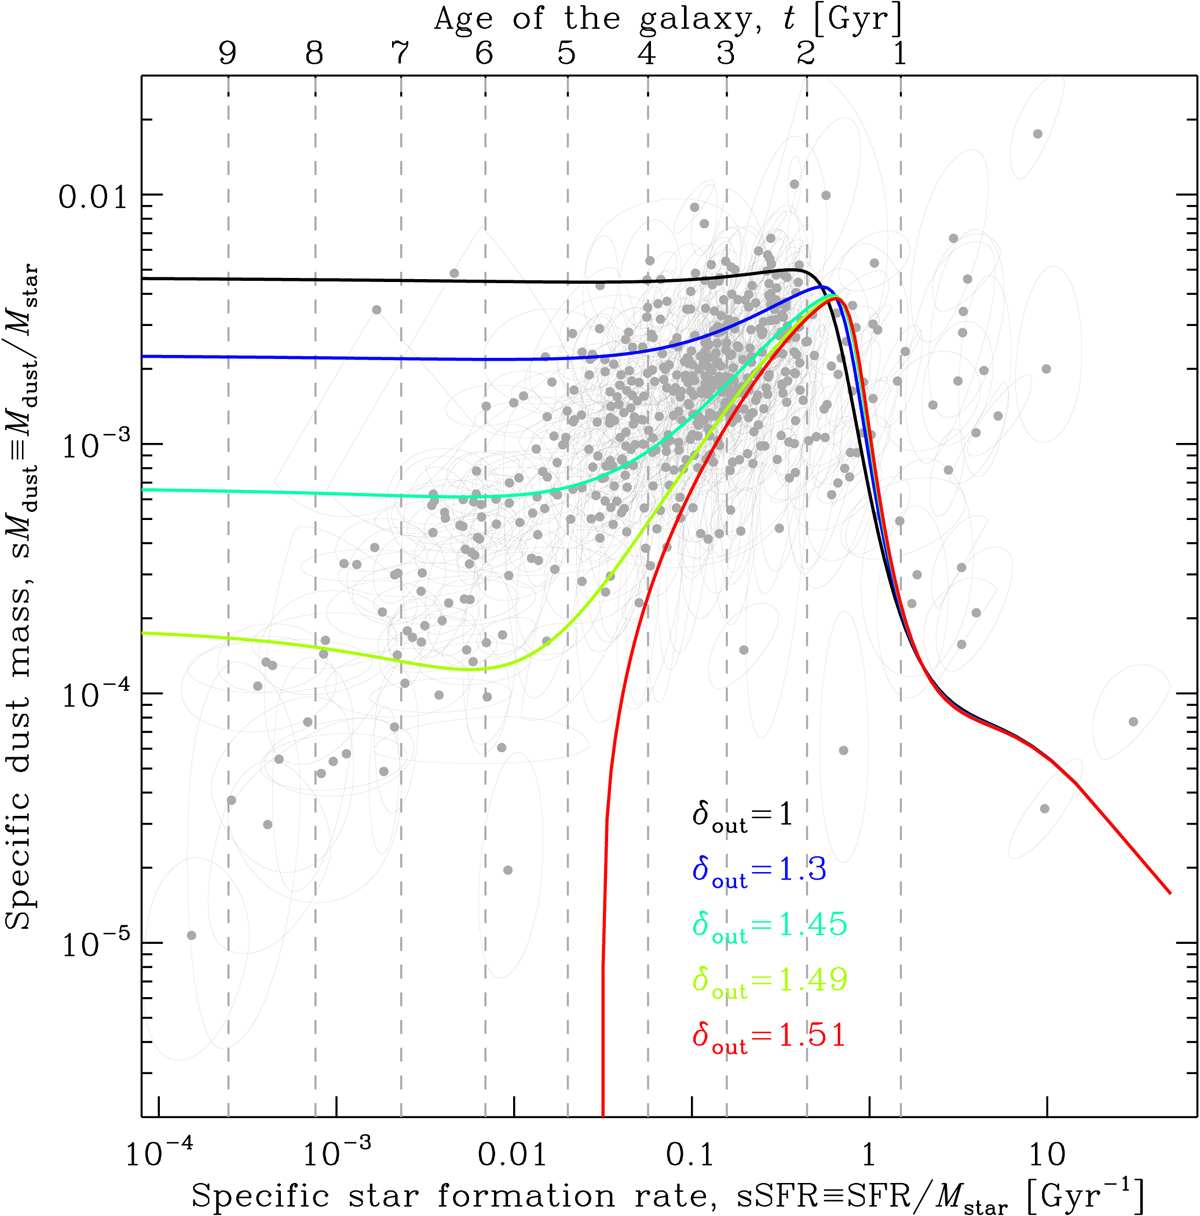
Effect of outflow on the sMdust–sSFR relation. The data are identical to panel c of Fig. 14. The colored lines represent our dust evolution model. We have fixed all the parameters close to their maximum a posterior values, except the outflow rate, δout: τSFH = 0.8 Gyr, ψ0 = 40 M⊙ yr−1, δin = 1.0, δSN = 0.01, ϵgrow = 4500, and ![]() . The different lines correspond to different values of δout. The top axis displays the age of the galaxy corresponding to the particular SFH of the model run. We have used a Salpeter (1955) IMF.
. The different lines correspond to different values of δout. The top axis displays the age of the galaxy corresponding to the particular SFH of the model run. We have used a Salpeter (1955) IMF.
Current usage metrics show cumulative count of Article Views (full-text article views including HTML views, PDF and ePub downloads, according to the available data) and Abstracts Views on Vision4Press platform.
Data correspond to usage on the plateform after 2015. The current usage metrics is available 48-96 hours after online publication and is updated daily on week days.
Initial download of the metrics may take a while.