Fig. 11.
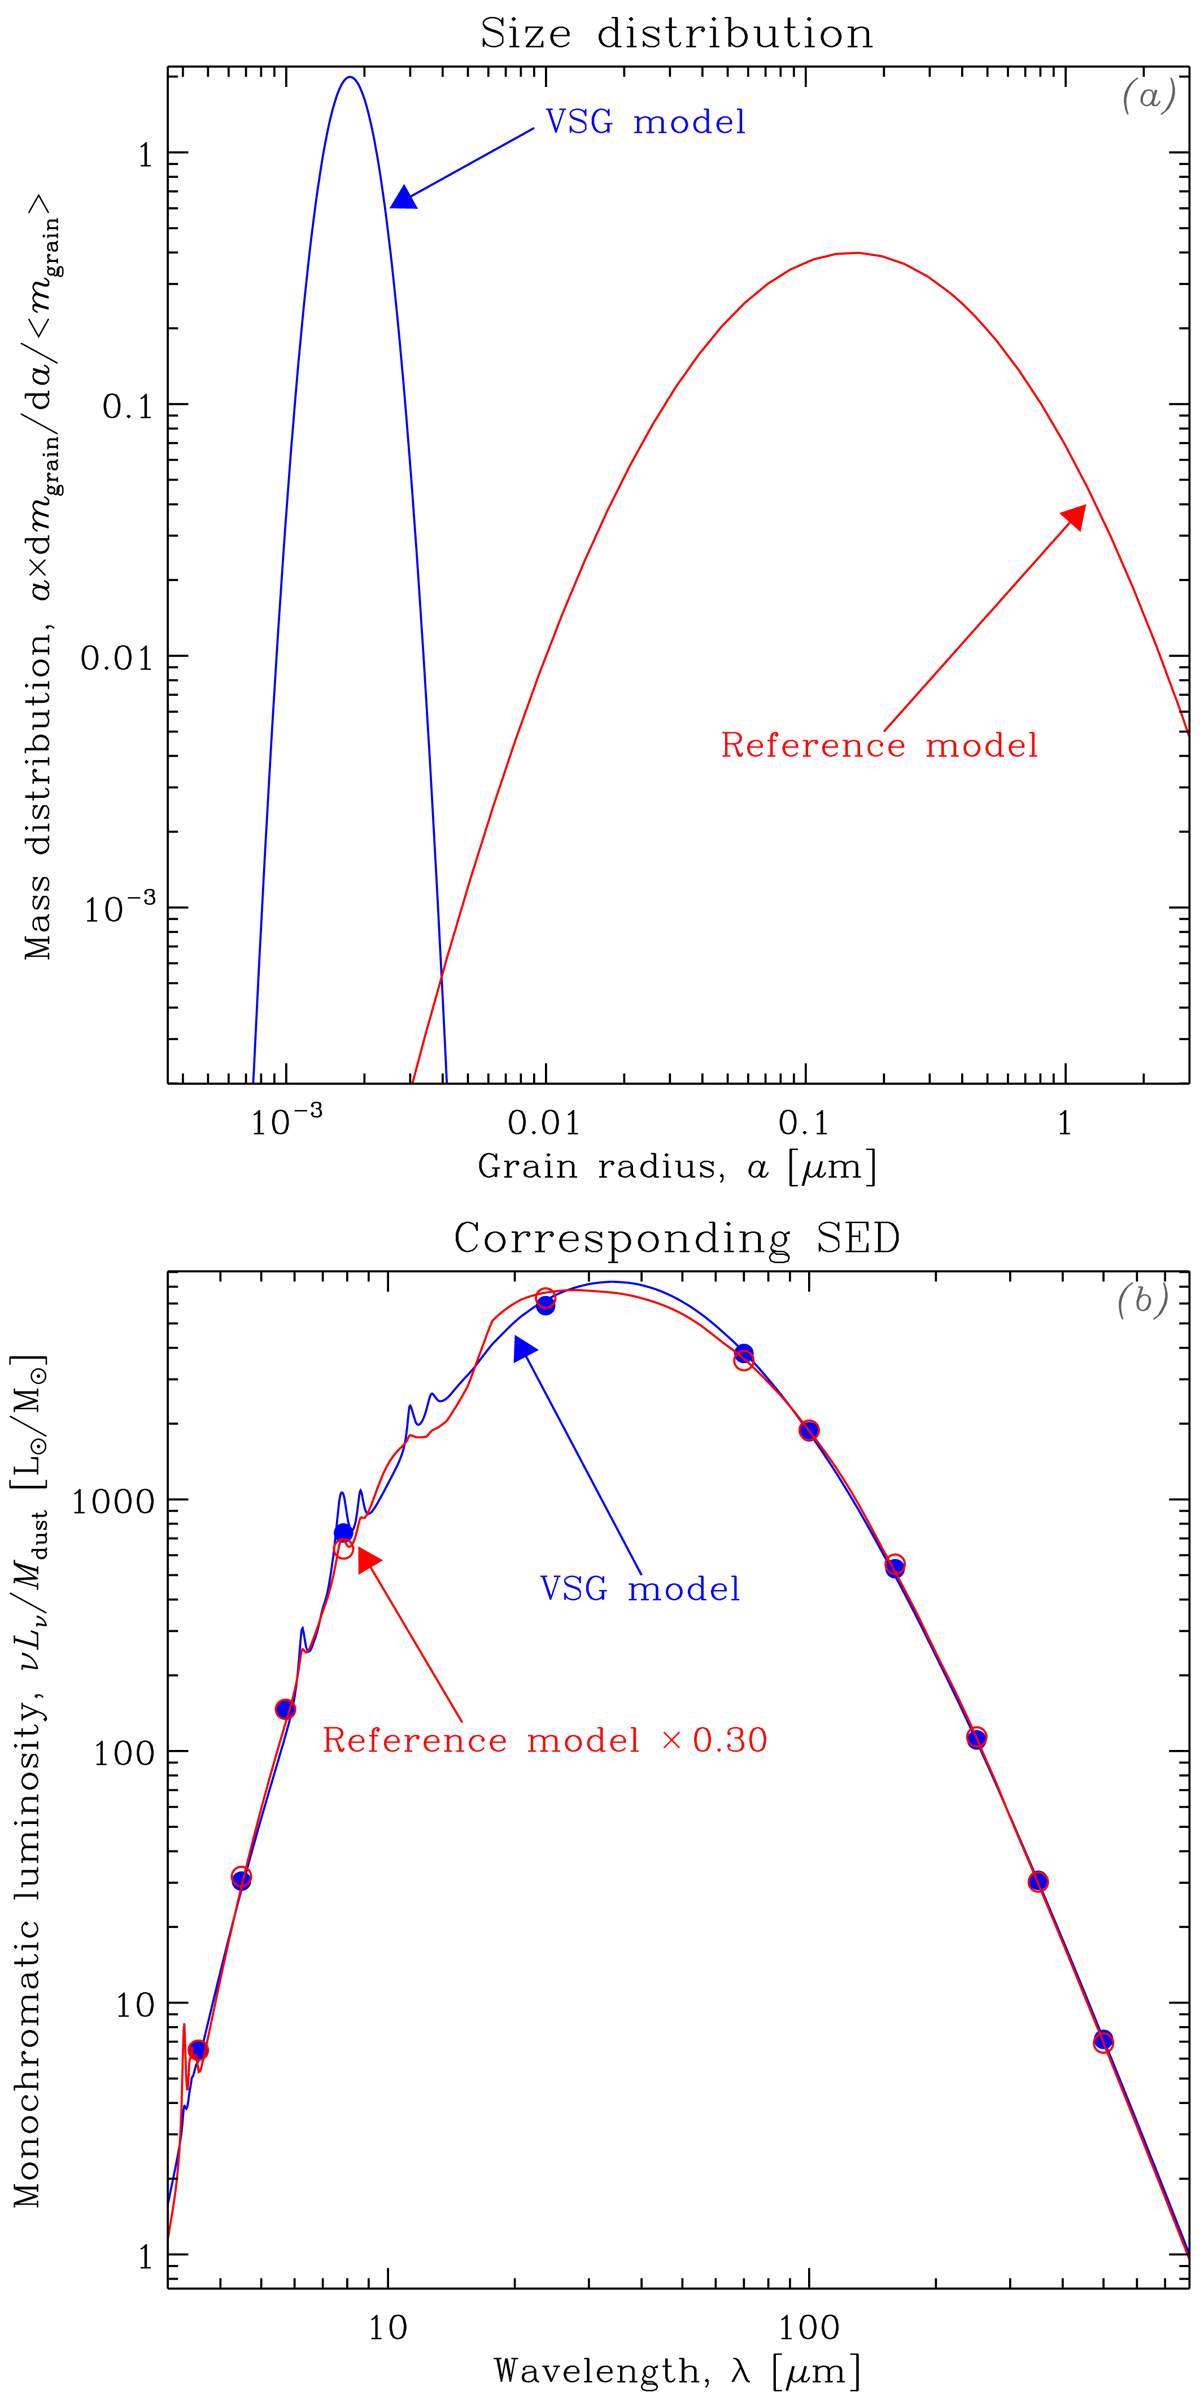
Demonstration of a VSG-dominated SED. Panel a: size distribution of the two models we are comparing here: the reference model in red, which is simply the THEMIS model, with the small grains scaled down to mimic the SED of a typical ELMG; and a VSG model, in blue, which is a log-normal size distribution, peaking at 1.5 nm with a log-width of 0.2. The optical properties of the VSG model are those of THEMIS, and we have kept the same silicate-to-carbon grain mass ratio. In both cases, the curves represent the size distributions of a-C(:H) and silicates. Panel b: corresponding SEDs for the two models. The SED of the reference model has been scaled down by a factor of 0.30, to fit the VSG SED. It means the VSG SED reproduces the reference model with a dust mass 3.33 times higher. The VSG SED is uniformly illuminated by an ISRF with U = 10, while the reference model has a distribution of ISRFs with ⟨U⟩ = 200. The blue filled and red empty circles show the synthetic photometry of each model in the IRAC, MIPS1, PACS, and SPIRE bands.
Current usage metrics show cumulative count of Article Views (full-text article views including HTML views, PDF and ePub downloads, according to the available data) and Abstracts Views on Vision4Press platform.
Data correspond to usage on the plateform after 2015. The current usage metrics is available 48-96 hours after online publication and is updated daily on week days.
Initial download of the metrics may take a while.