Fig. 10.
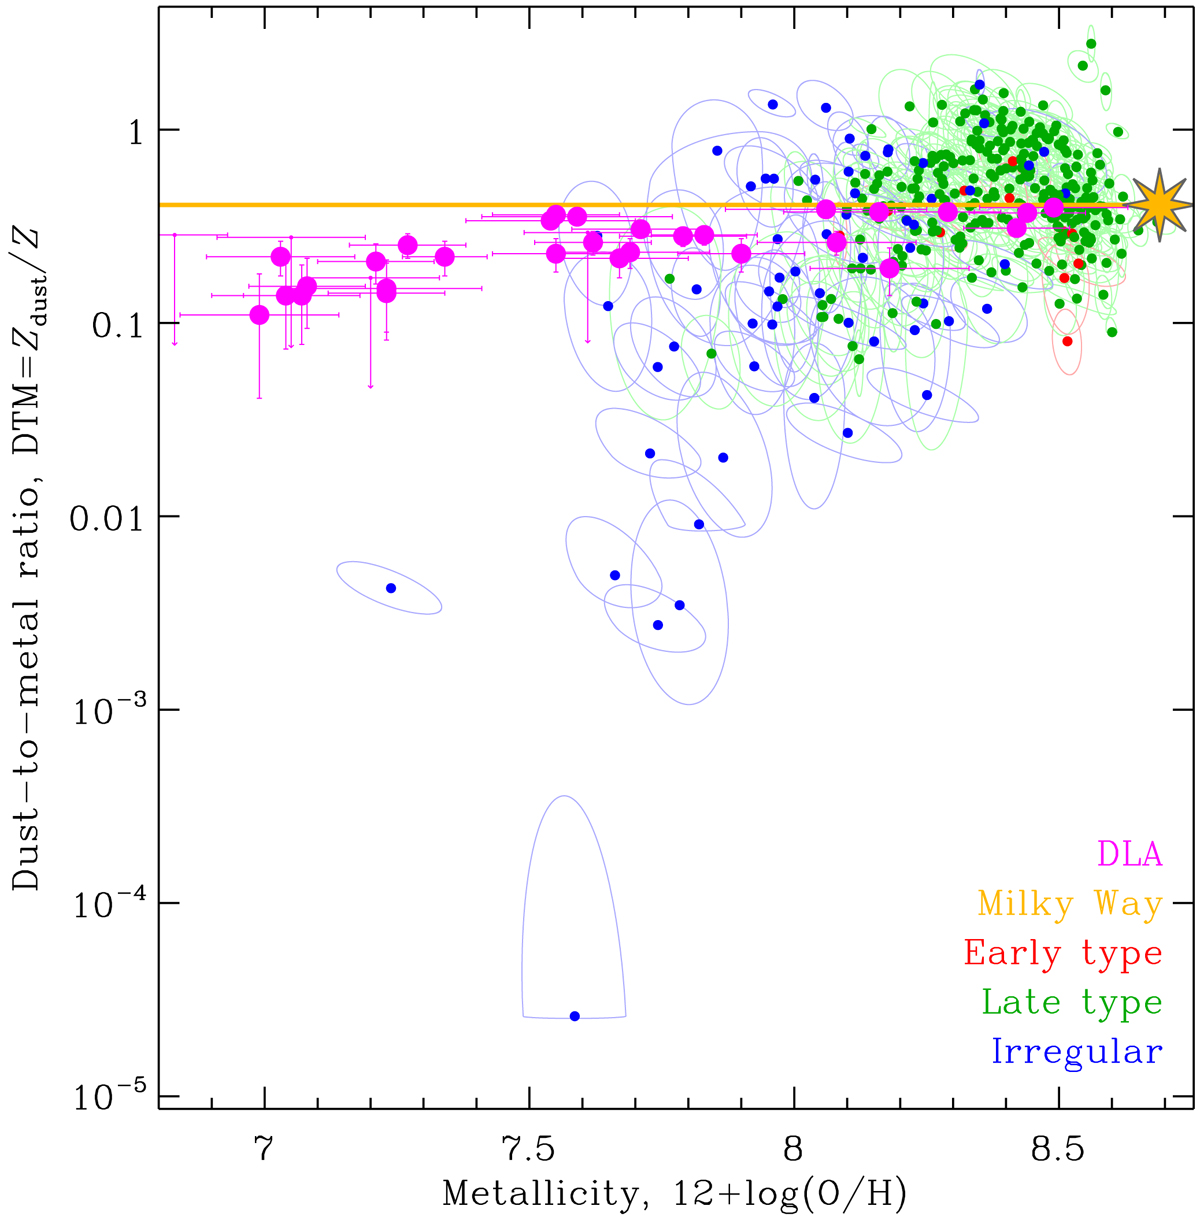
Comparison to DLAs. This figure shows the relation between the metallicity and the dust-to-metal mass ratio, for the reference run (Sect. 3.2). This figure is very similar to panel d of Fig. 8: the only difference is that the y-axis has been divided by Z (related to the x-axis through Eq. (1)). We have overlaid in magenta the DLA measures from Table 6 of De Cia et al. (2016). The horizontal yellow line corresponds to the Galactic dust-to-metal mass ratio. The Bayesian correlation coefficient of the nearby galaxy sample is ![]() , with CR95%(ρ) = [0.59, 0.68].
, with CR95%(ρ) = [0.59, 0.68].
Current usage metrics show cumulative count of Article Views (full-text article views including HTML views, PDF and ePub downloads, according to the available data) and Abstracts Views on Vision4Press platform.
Data correspond to usage on the plateform after 2015. The current usage metrics is available 48-96 hours after online publication and is updated daily on week days.
Initial download of the metrics may take a while.