Fig. 6.
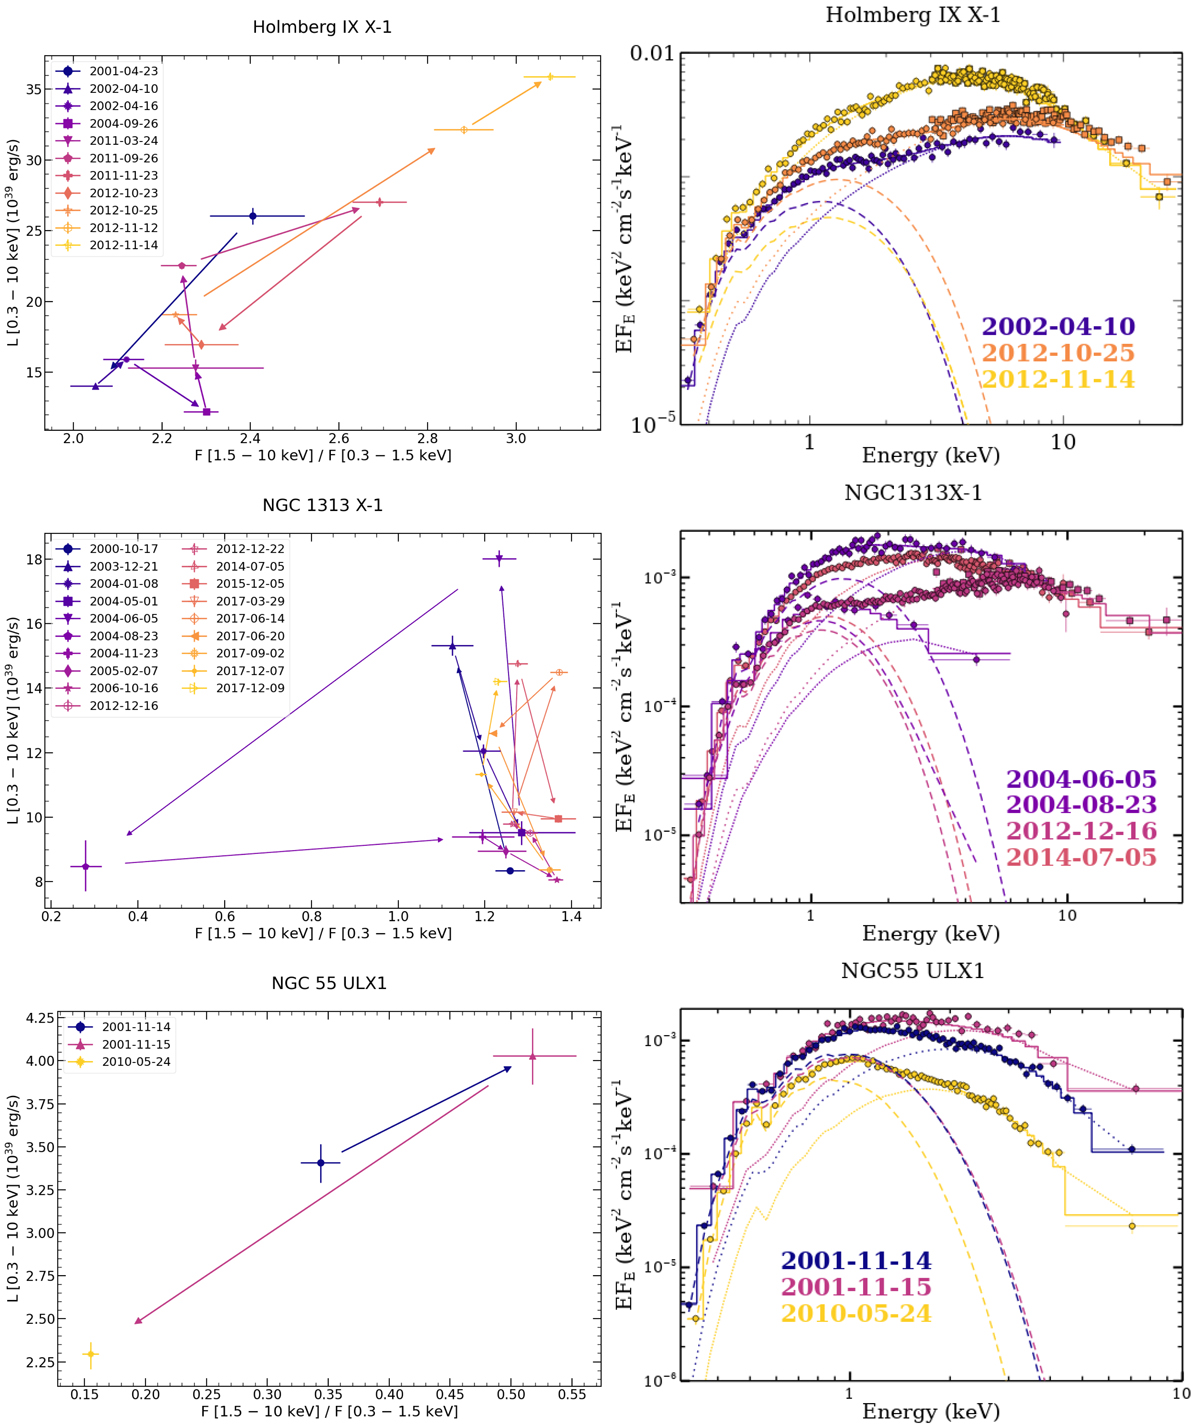
Left: temporal tracks on the HLD. Filled coloured markers indicate fluxes obtained from XMM-Newton data, unfilled markers indicate fluxes obtained from joint XMM-Newton-NuSTAR data, and black-filled markers indicate fluxes obtained from Chandra data. The legend indicates the date of the epoch in each case. Right: unfolded spectra for selected epochs in which the source has experienced strong changes, following the same colour-code as for the left panels. Selected epochs are indicated in the legend. For the EPIC data, only pn is shown (circles) or MOS1 if pn is not available (as triangles up). In cases where we have used NuSTAR data, FPMA is shown, represented as squares and with the same colour as pn. Chandra data are shown with downward-pointing triangles. The soft and hard diskbb model components are shown with a dashed line and dotted line respectively, while the total model is shown with a solid line. For epochs where the simpl model has been used see Table 2. Data have been rebinned for clarity.
Current usage metrics show cumulative count of Article Views (full-text article views including HTML views, PDF and ePub downloads, according to the available data) and Abstracts Views on Vision4Press platform.
Data correspond to usage on the plateform after 2015. The current usage metrics is available 48-96 hours after online publication and is updated daily on week days.
Initial download of the metrics may take a while.