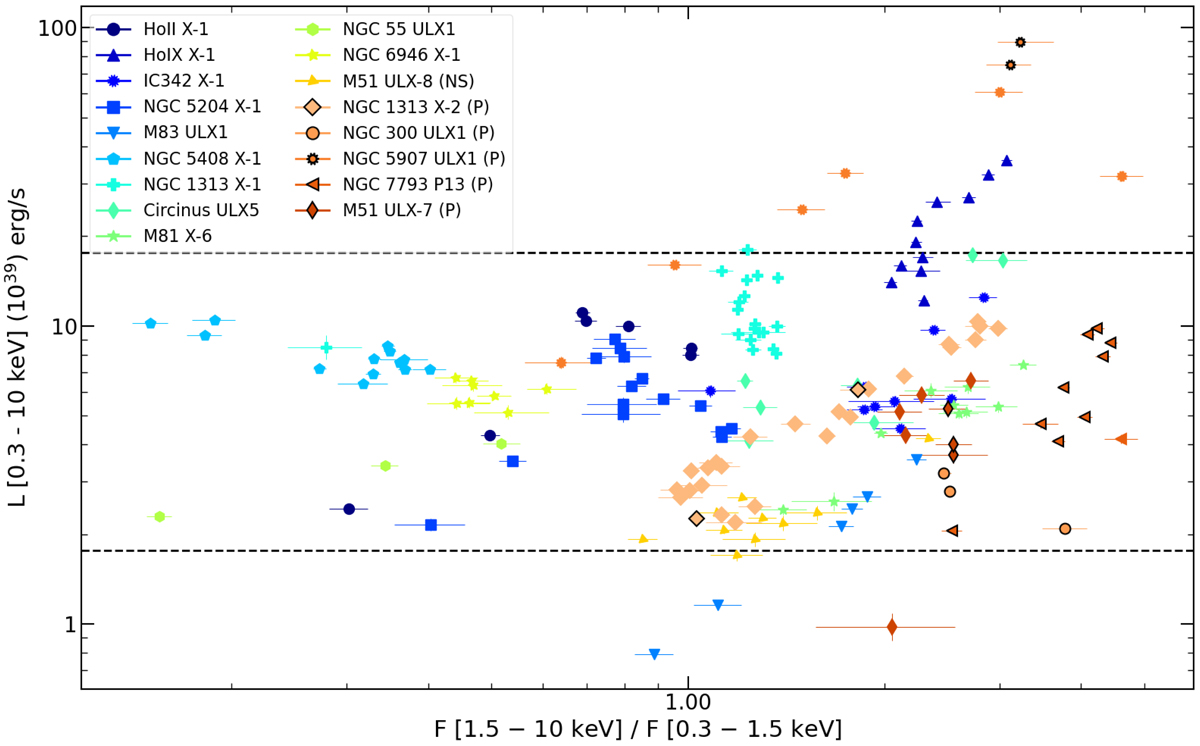
Fig. 4.

Hardness–luminosity diagram for the ULX sample selected for this study. All fluxes and luminosities are unabsorbed. PULXs are shown in shades of orange and the epochs for which pulsations have been reported in the literature (Israel et al. 2017a; Fürst et al. 2018; Carpano et al. 2018; Vasilopoulos et al. 2018; Sathyaprakash et al. 2019; Rodríguez-Castillo et al. 2020) are highlighted by a black edge around the marker. The dashed black lines indicate respectively 10 and 100 times the Eddington limit for a NS (∼2 × 1038 erg s−1).
Current usage metrics show cumulative count of Article Views (full-text article views including HTML views, PDF and ePub downloads, according to the available data) and Abstracts Views on Vision4Press platform.
Data correspond to usage on the plateform after 2015. The current usage metrics is available 48-96 hours after online publication and is updated daily on week days.
Initial download of the metrics may take a while.


