Fig. 8.
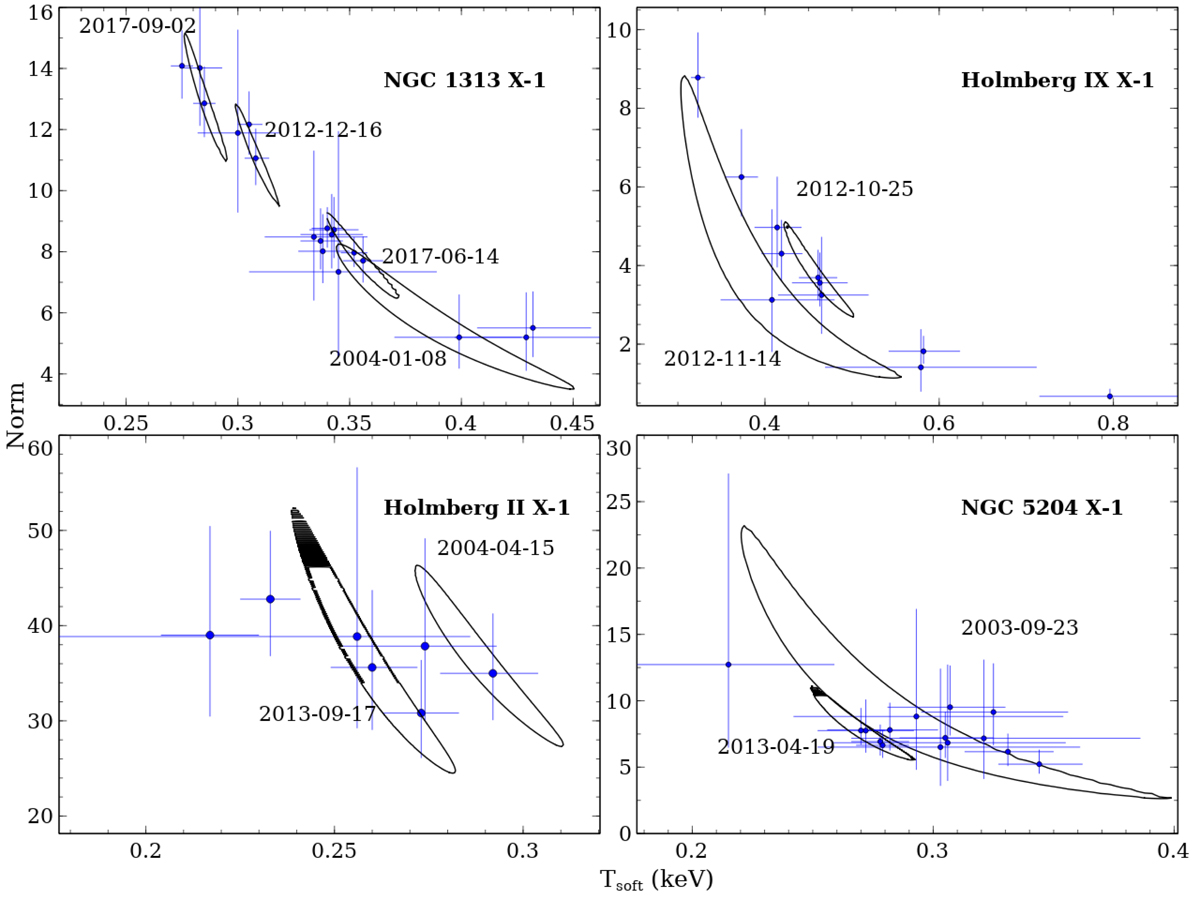
99% χ2 contours (solid black lines) between Tsoft and its normalisation for sources showing a positive L–T correlation. For each source, two to four different epochs are represented with the epoch indicated next to the contour. A clear anti-correlation is seen in all cases that closely follows the best-fit values from all the epochs (blue datapoints, 90% confidence level error bars), which indicates that the L–T positive correlation is due to the degeneracy between these two parameters. For the sake of readability, we have ignored epoch 2004-06-05 in the panel of NGC 1313 X-1 as it had a much higher normalisation (∼51) compared to the other observations.
Current usage metrics show cumulative count of Article Views (full-text article views including HTML views, PDF and ePub downloads, according to the available data) and Abstracts Views on Vision4Press platform.
Data correspond to usage on the plateform after 2015. The current usage metrics is available 48-96 hours after online publication and is updated daily on week days.
Initial download of the metrics may take a while.