Fig. 9.
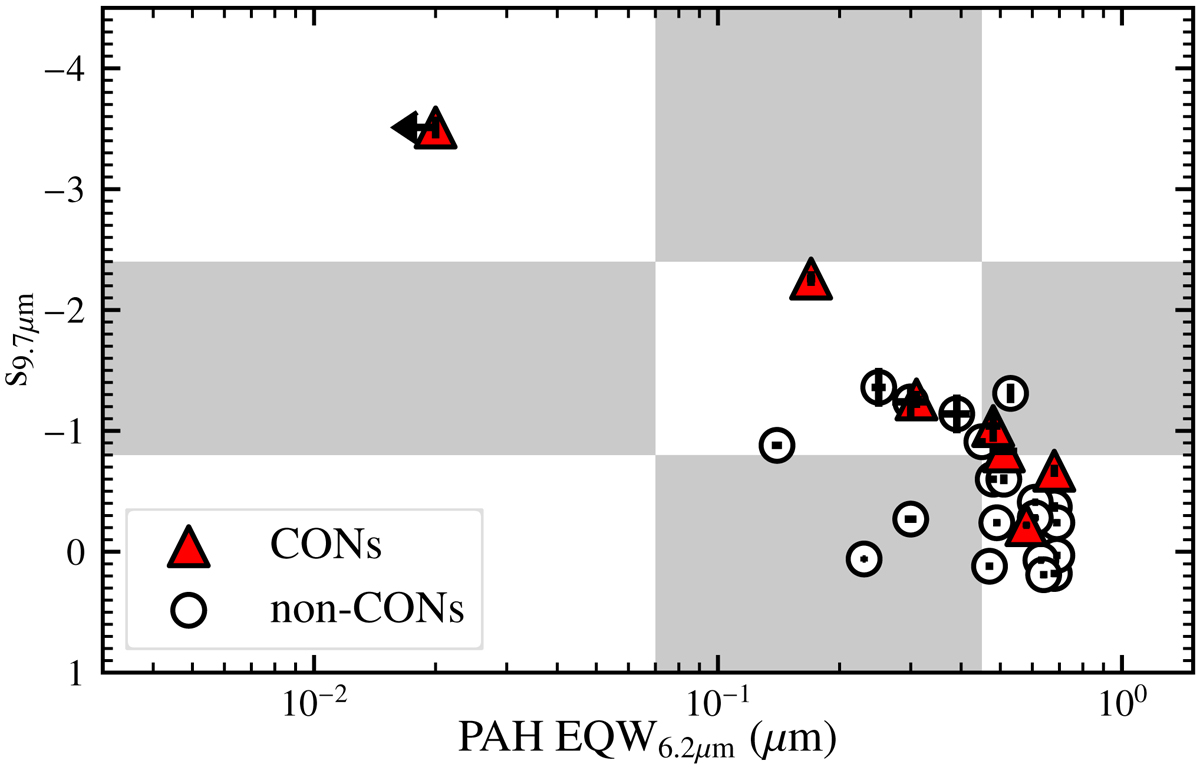
Diagnostic plot of the strength of the 9.7 μm silicate feature against the equivalent width of the 6.2 μm PAH feature suggested by Spoon et al. (2007). The CON-quest LIRGs and ULIRGs are plotted using data presented by Stierwalt et al. (2013); CONs are plotted as red triangles and non-CONs are plotted as white circles. The shaded and white rectangles indicate the approximate regions of the plot used by Spoon et al. (2007) to divide sources into different classes.
Current usage metrics show cumulative count of Article Views (full-text article views including HTML views, PDF and ePub downloads, according to the available data) and Abstracts Views on Vision4Press platform.
Data correspond to usage on the plateform after 2015. The current usage metrics is available 48-96 hours after online publication and is updated daily on week days.
Initial download of the metrics may take a while.