Fig. 7.
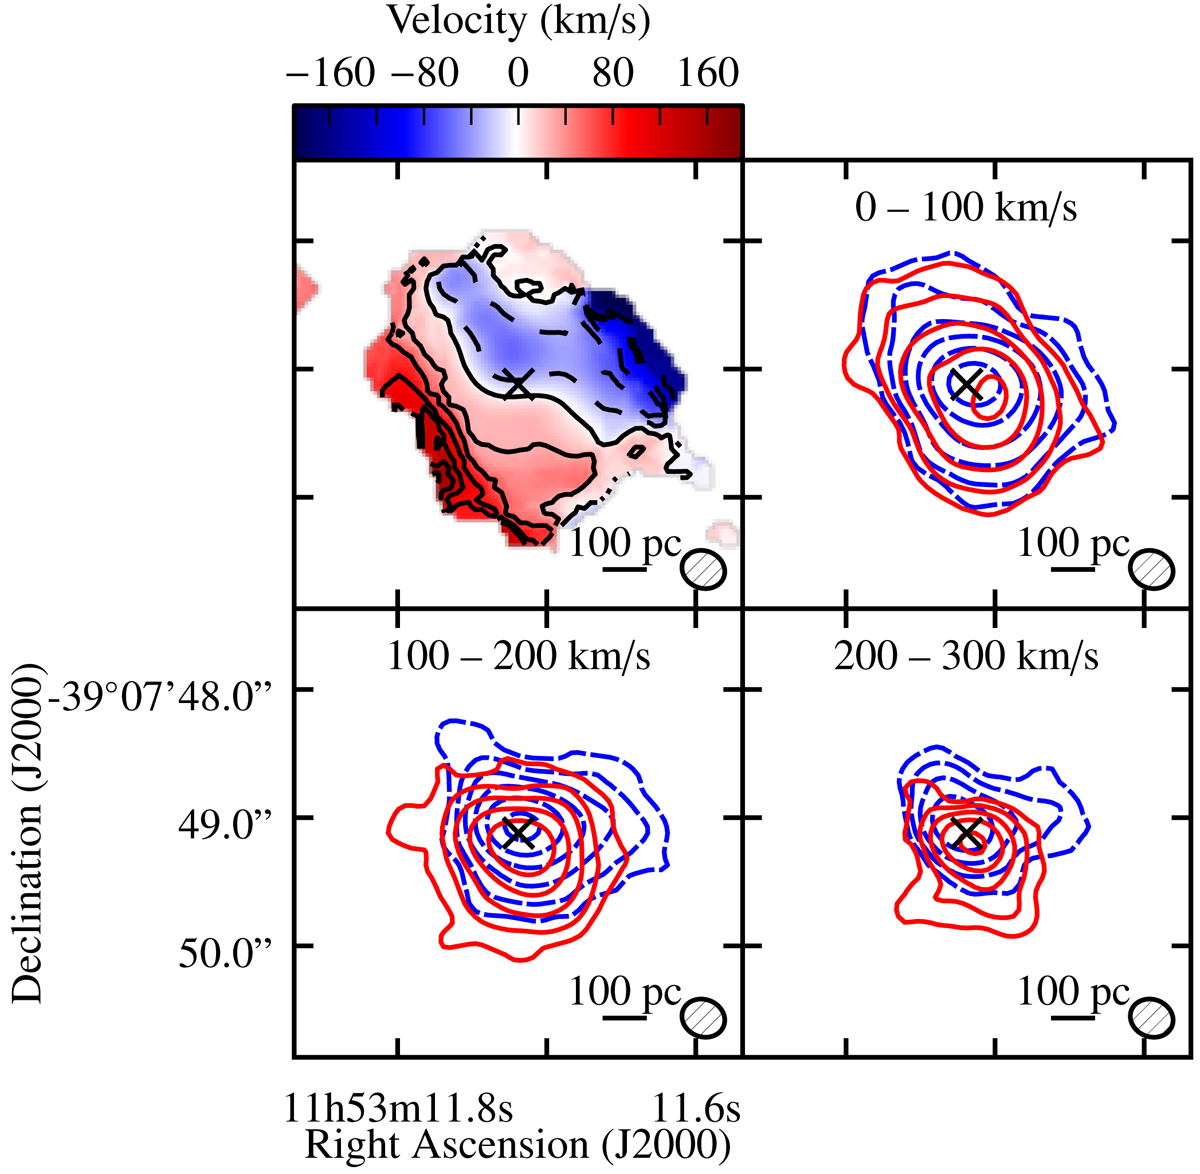
Intensity weighted velocity (moment 1) map and integrated intensity contours of HCN taken over the velocity ranges 0−100, 100−200, and 200−300 km s−1 from the systemic velocity (∼3080 km s−1) on the red- (solid) and blueshifted (dashed) sides in ESO 320-G030. Velocity contours are given every 30 km s−1. Integrated intensity contours start at 0.24, 0.16, and 0.11 Jy beam−1 km s−1 (5σ) for the three velocity intervals, respectively, and increase by factors of 2.
Current usage metrics show cumulative count of Article Views (full-text article views including HTML views, PDF and ePub downloads, according to the available data) and Abstracts Views on Vision4Press platform.
Data correspond to usage on the plateform after 2015. The current usage metrics is available 48-96 hours after online publication and is updated daily on week days.
Initial download of the metrics may take a while.