Fig. 6.
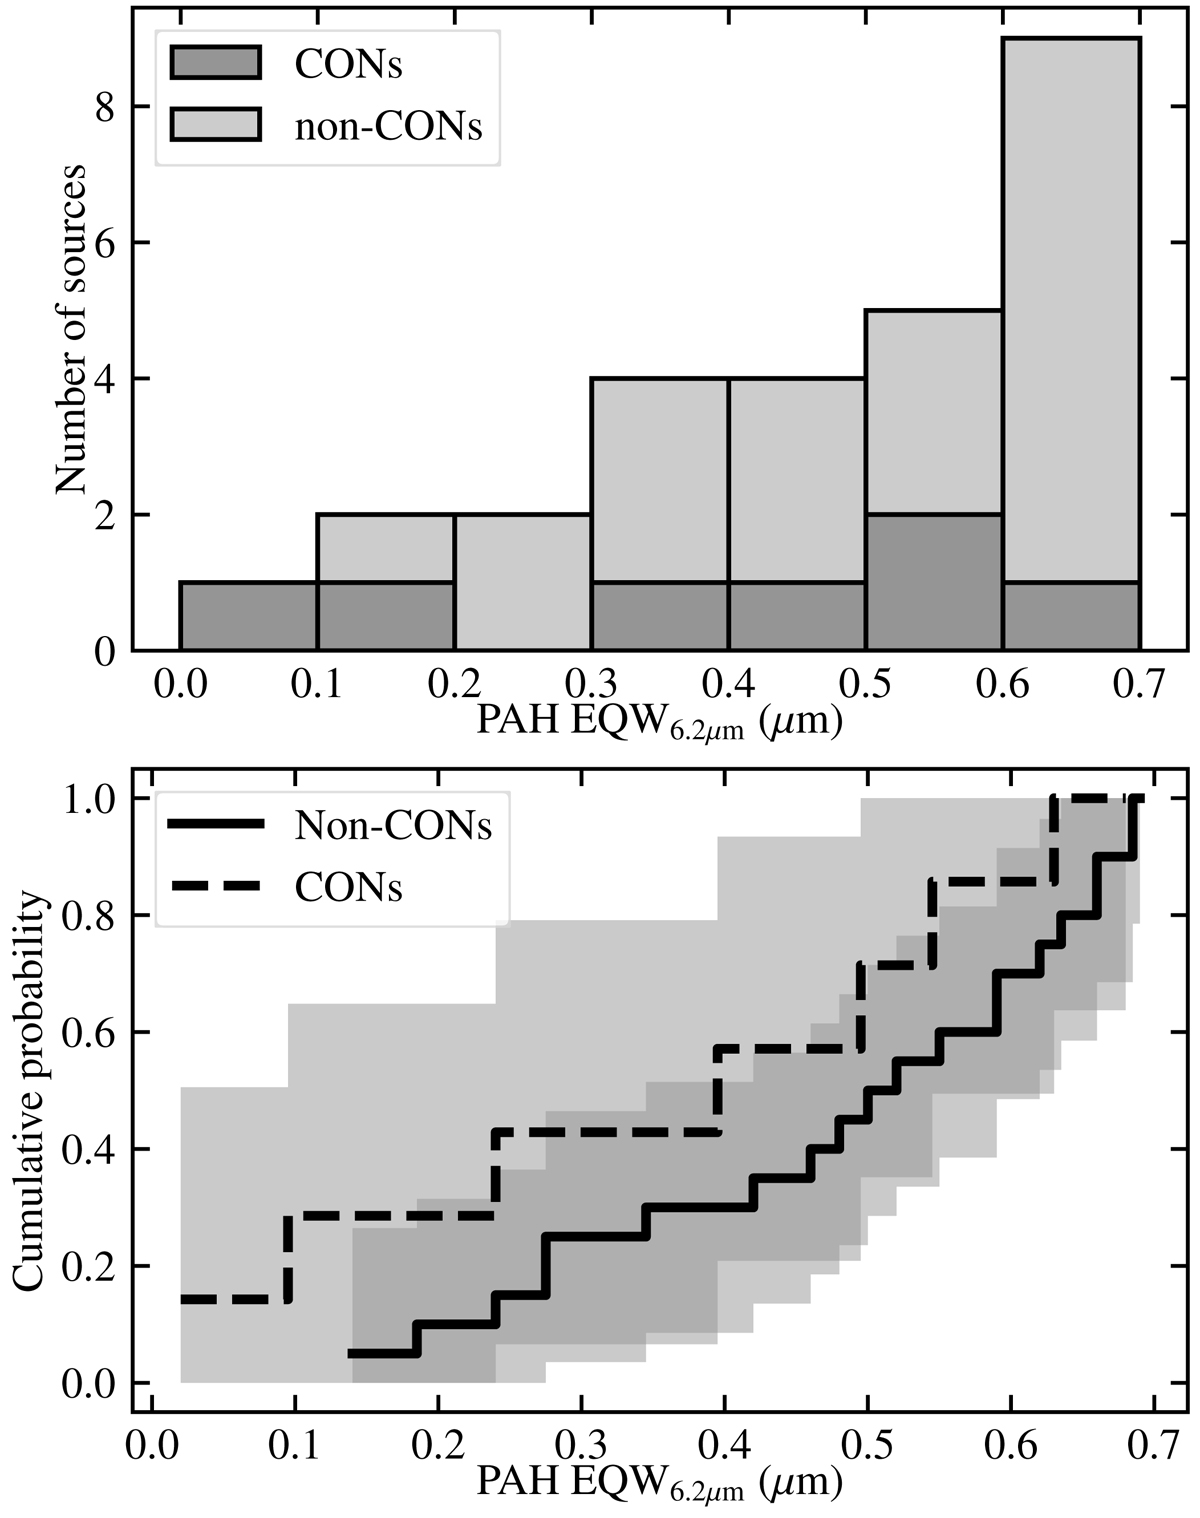
Distribution of the equivalent width of the 6.2 μm PAH feature in the (U)LIRG sample of CON-quest. Top: stacked histogram of the CON-quest sample with CONs represented with a darker shade. Bottom: empirical distribution functions of the CON and non-CON parts of the sample. The 1σ confidence intervals are indicated with gray shading.
Current usage metrics show cumulative count of Article Views (full-text article views including HTML views, PDF and ePub downloads, according to the available data) and Abstracts Views on Vision4Press platform.
Data correspond to usage on the plateform after 2015. The current usage metrics is available 48-96 hours after online publication and is updated daily on week days.
Initial download of the metrics may take a while.