Fig. A.1.
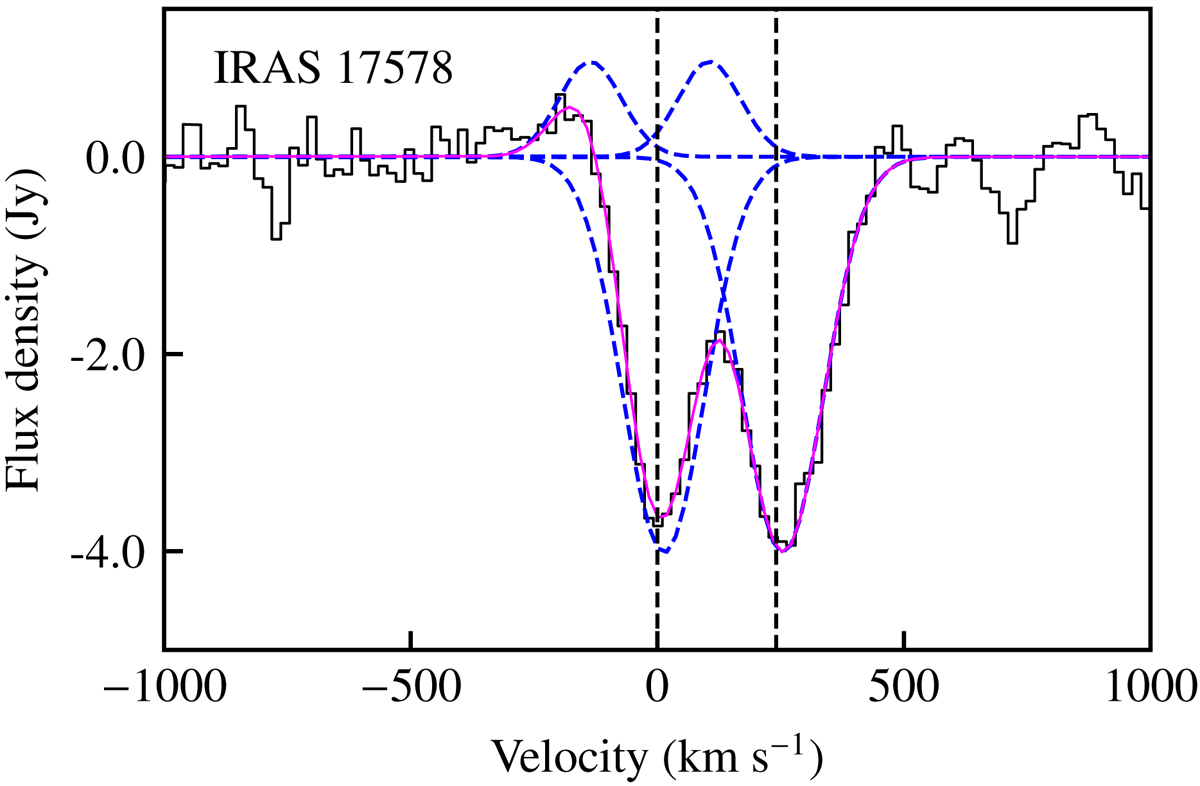
Spectral fits to the OH 79 μm absorption lines in IRAS 17578–0400. The solid black histogram represents the data, the solid magenta line indicates the best multicomponent fit to the data, and the dashed blue lines are the individual components. The velocity scale is set relative to the frequency of the blue component of the doublet. The dashed vertical lines indicate the expected positions of the two absorption components given the adopted redshift of 0.0134.
Current usage metrics show cumulative count of Article Views (full-text article views including HTML views, PDF and ePub downloads, according to the available data) and Abstracts Views on Vision4Press platform.
Data correspond to usage on the plateform after 2015. The current usage metrics is available 48-96 hours after online publication and is updated daily on week days.
Initial download of the metrics may take a while.