Fig. 1.
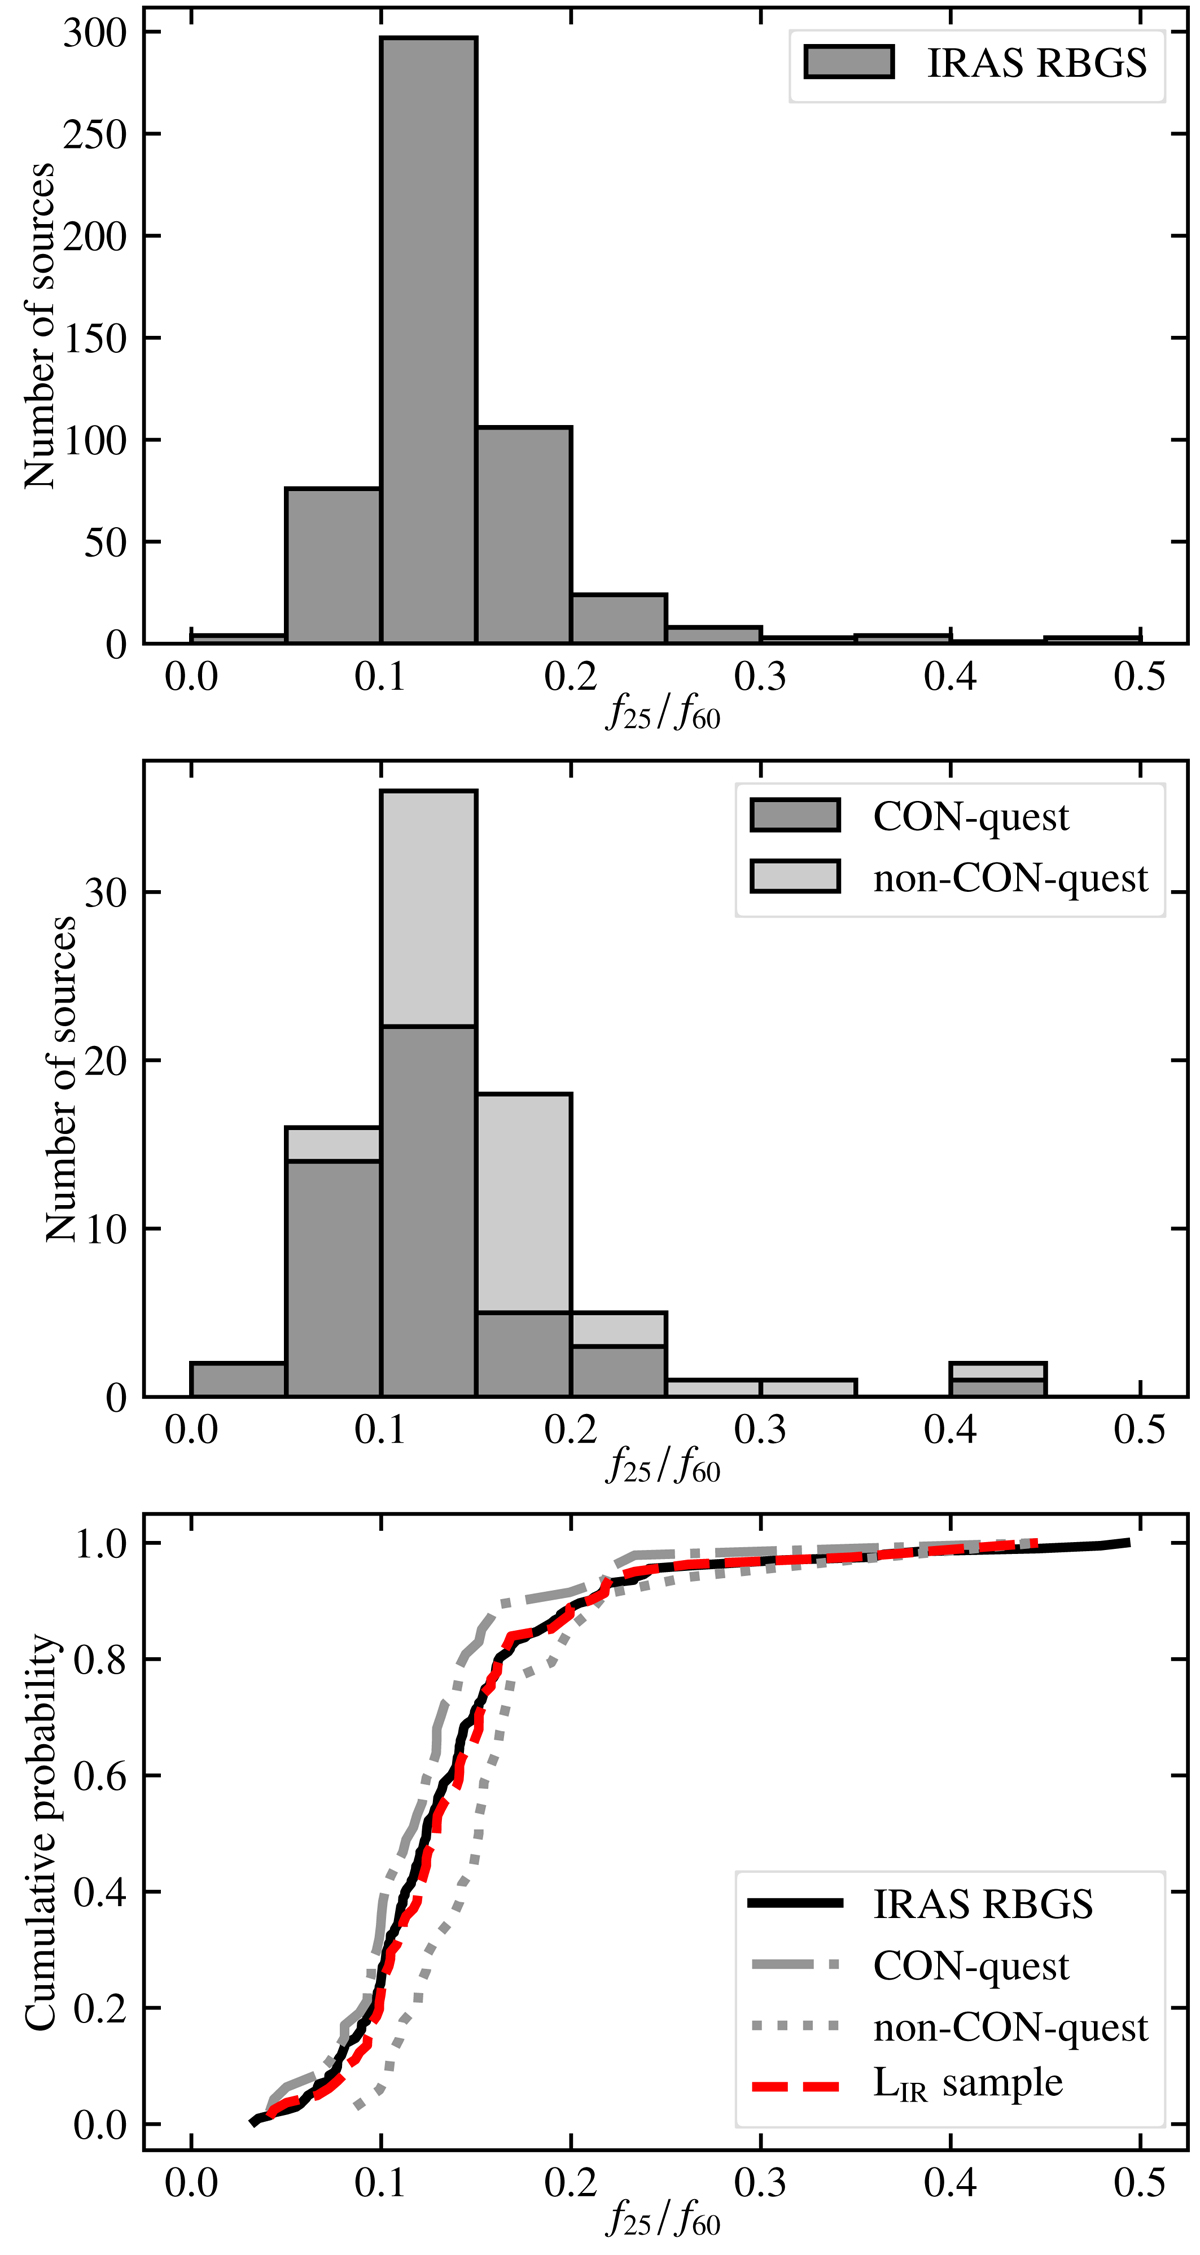
Distributions of IRAS 25/60 μm ratios in various samples. Top: histogram showing the distribution in the IRAS revised bright galaxy sample (RBGS). Middle: stacked histogram showing the distribution in the sample that would have resulted if sources were selected based on the total infrared luminosity (between 8 μm and 1000 μm) instead of the far-infrared luminosity (between 40 and 400 μm), with the CON-quest sample marked using a darker shade. Bottom: empirical distribution functions of the RBGS (solid black), the CON-quest sample (dash-dotted gray), the additional sources required to complete an infrared selected sample (dotted gray), and the total infrared selected sample (dashed red).
Current usage metrics show cumulative count of Article Views (full-text article views including HTML views, PDF and ePub downloads, according to the available data) and Abstracts Views on Vision4Press platform.
Data correspond to usage on the plateform after 2015. The current usage metrics is available 48-96 hours after online publication and is updated daily on week days.
Initial download of the metrics may take a while.