Open Access
Fig. 2.
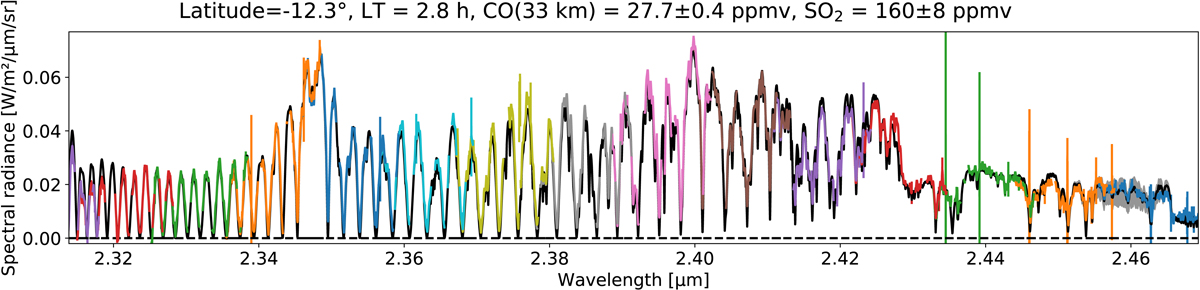
Spectrum observed on January 3, 2019 (colour coding for the different, partially overlapping grating orders) and its best fit (in black). The grey shaded area near 2.46 μm shows the sensitivity to the SO2 mixing ratio (shaded between ×2 and ×0.5 the best fit value).
Current usage metrics show cumulative count of Article Views (full-text article views including HTML views, PDF and ePub downloads, according to the available data) and Abstracts Views on Vision4Press platform.
Data correspond to usage on the plateform after 2015. The current usage metrics is available 48-96 hours after online publication and is updated daily on week days.
Initial download of the metrics may take a while.