Fig. 3.
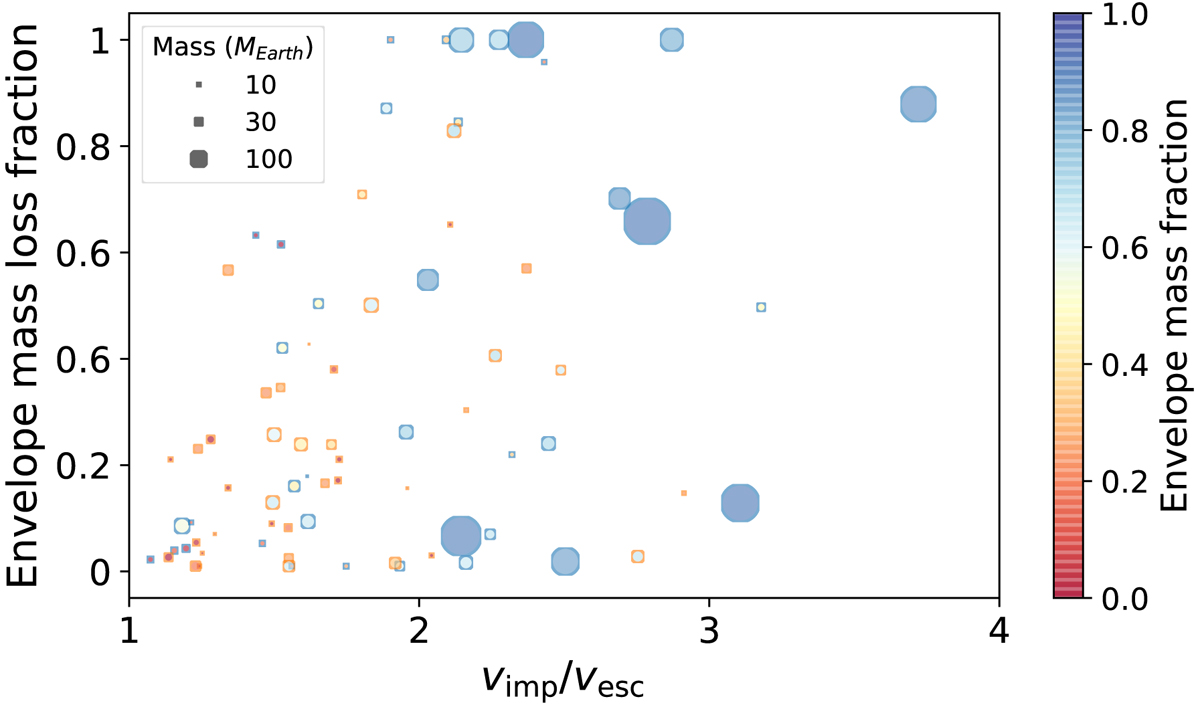
Envelope mass-loss fraction for all the giant impacts in the simulations with the fiducial pebble flux. Circles with blue edges represent collisions in simulations without PEW effects, while those with orange edges are in simulations with PEW effects. Each size is proportional to mass, and the color corresponds to its envelope fraction before impacts. A summary of all mass loss events is presented in Fig. A.1.
Current usage metrics show cumulative count of Article Views (full-text article views including HTML views, PDF and ePub downloads, according to the available data) and Abstracts Views on Vision4Press platform.
Data correspond to usage on the plateform after 2015. The current usage metrics is available 48-96 hours after online publication and is updated daily on week days.
Initial download of the metrics may take a while.