Fig. 2.
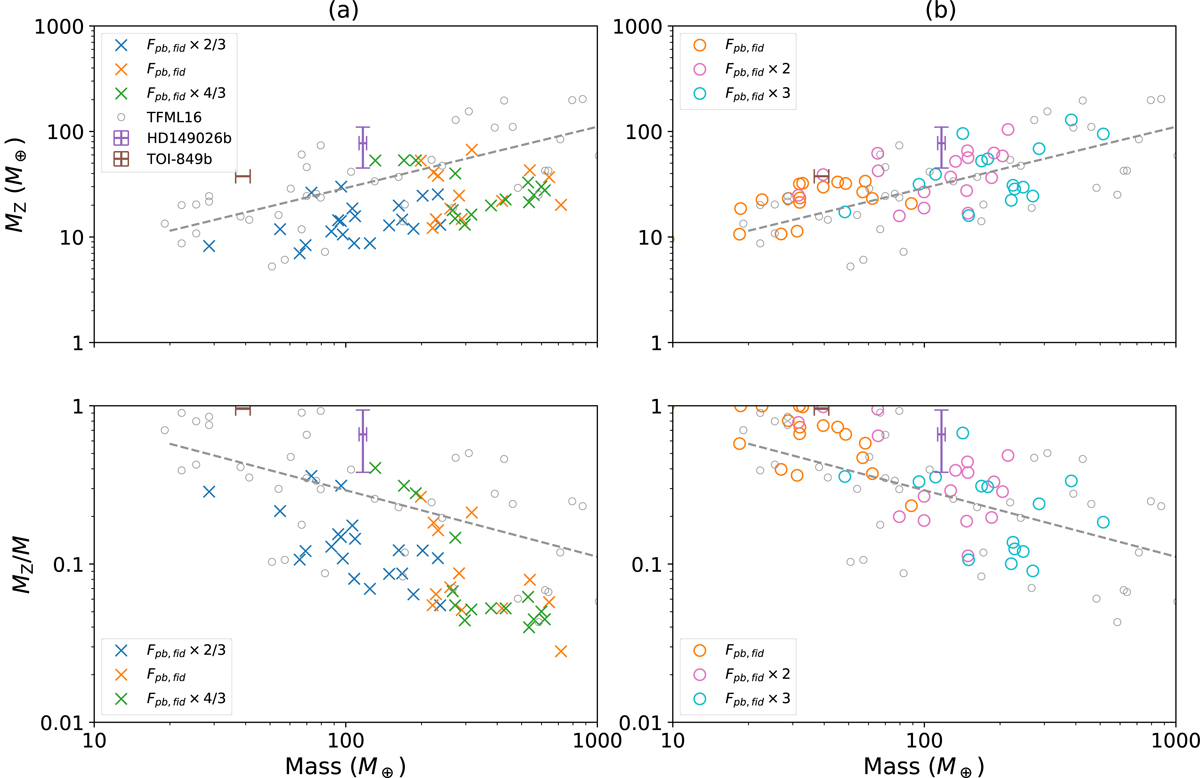
Comparison of the metal mass Mz and metal-mass fraction Mz/M between the observed transiting giant planets and the results of our simulations. Gray circles indicate the estimates by Thorngren et al. (2016), which were fitted by power-law distributions (dashed lines). HD 149026b and TOI-849b are plotted with purple and brown symbols, respectively. The simulation results are plotted with cresses and circles. The pebble flux was varied, and five runs were performed for each pebble flux. (a) Without PEW, (b) with PEW.
Current usage metrics show cumulative count of Article Views (full-text article views including HTML views, PDF and ePub downloads, according to the available data) and Abstracts Views on Vision4Press platform.
Data correspond to usage on the plateform after 2015. The current usage metrics is available 48-96 hours after online publication and is updated daily on week days.
Initial download of the metrics may take a while.