Free Access
Fig. A.1.
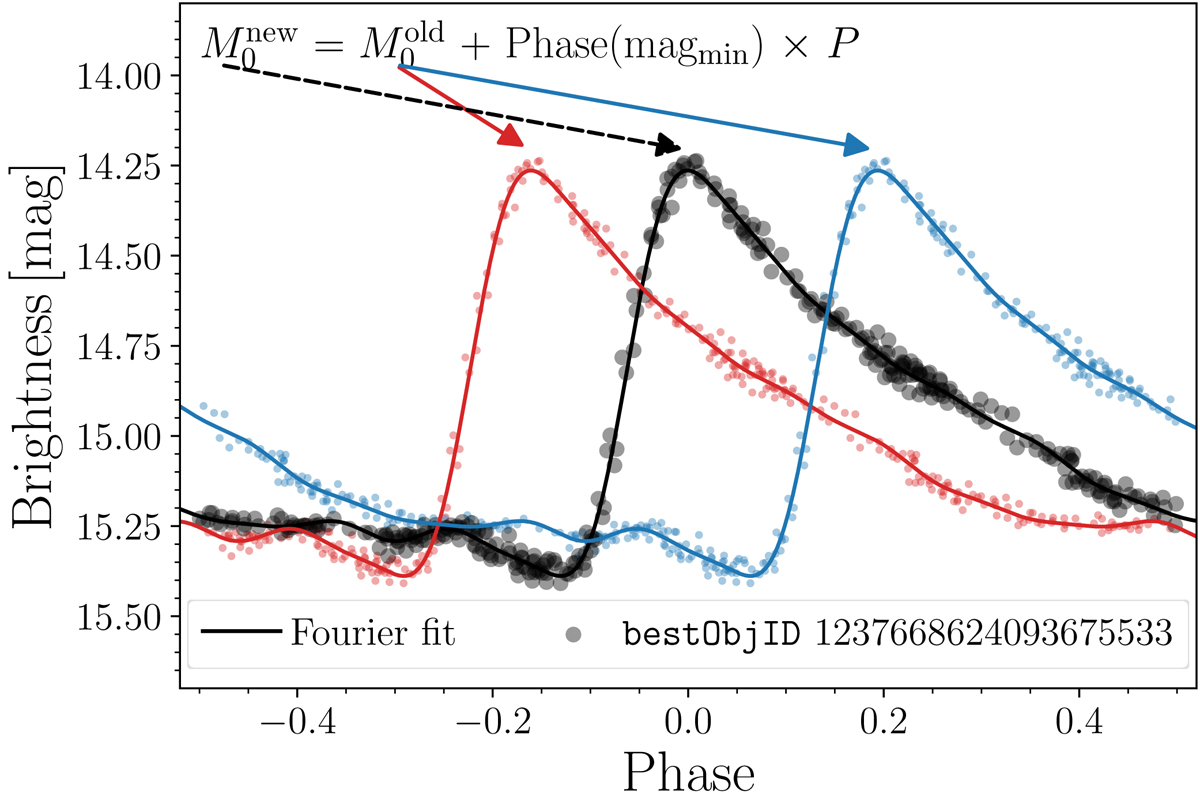
Example of the M0 determination based on CSS photometry for one of the sample stars. The blue and red dots represent erroneous M0 that were subsequently corrected by a phase shift of the time of brightness maxima (determined from the Fourier fit) multiplied by the pulsation period.
Current usage metrics show cumulative count of Article Views (full-text article views including HTML views, PDF and ePub downloads, according to the available data) and Abstracts Views on Vision4Press platform.
Data correspond to usage on the plateform after 2015. The current usage metrics is available 48-96 hours after online publication and is updated daily on week days.
Initial download of the metrics may take a while.