Fig. 7.
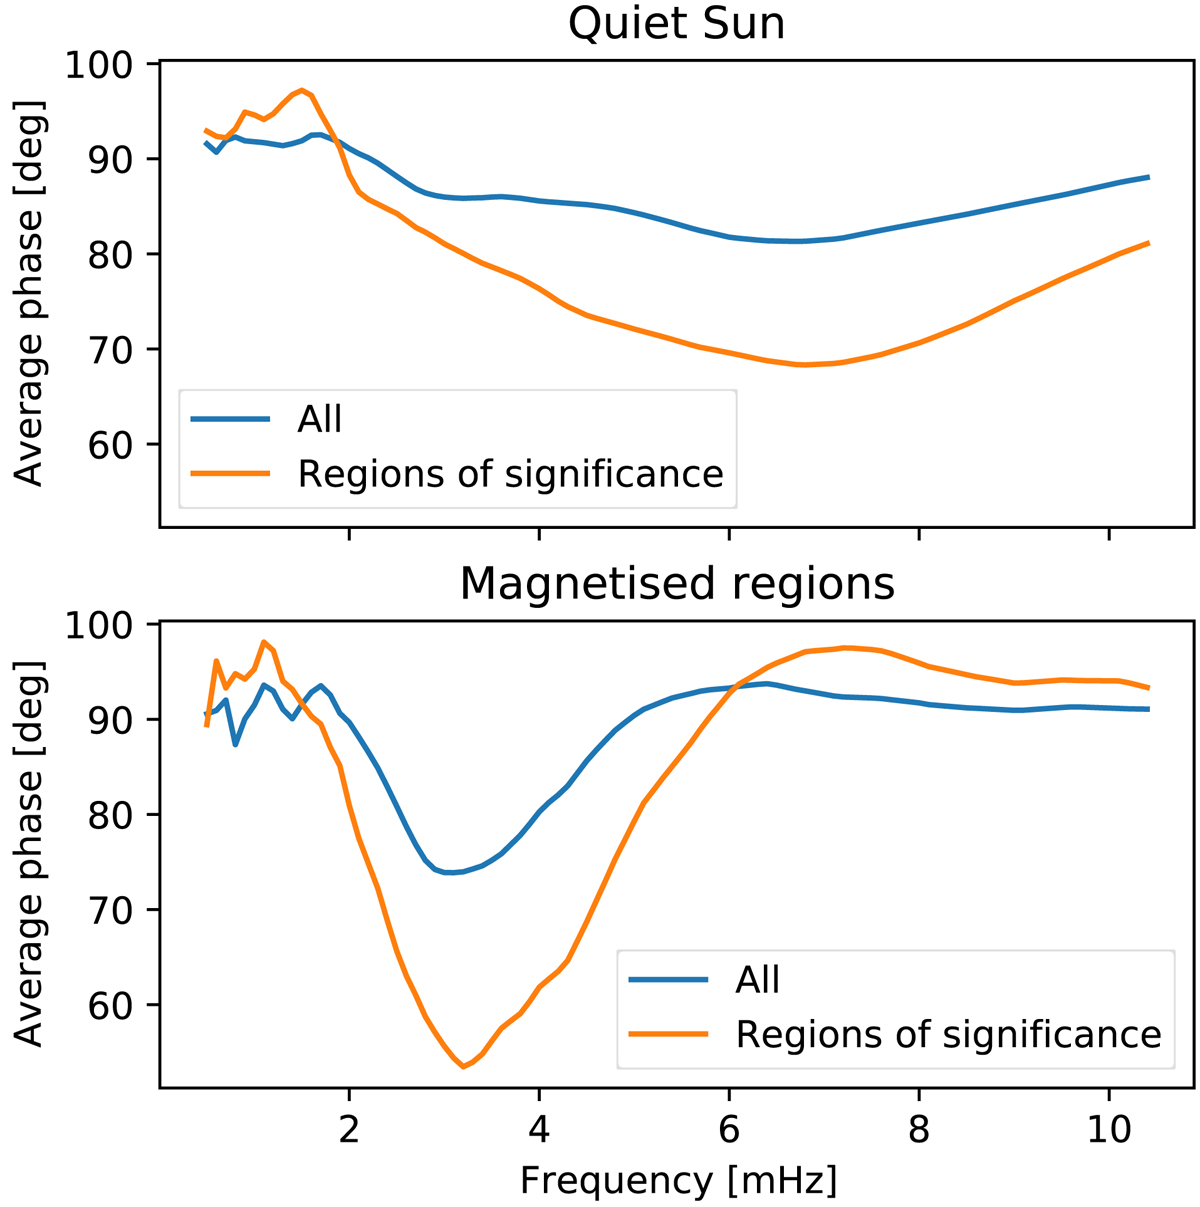
Average wave phase shifts between the upper- and lower-height boundaries of the chromospheric layer under study plotted separately for the nonmagnetic (upper panel) and magnetic (lower panel) pixels. The averages are plotted for all contributions in the time-frequency wavelet spectrum (blue) and only for those contributions where a statistically significant wavelet coherence was indicated (orange).
Current usage metrics show cumulative count of Article Views (full-text article views including HTML views, PDF and ePub downloads, according to the available data) and Abstracts Views on Vision4Press platform.
Data correspond to usage on the plateform after 2015. The current usage metrics is available 48-96 hours after online publication and is updated daily on week days.
Initial download of the metrics may take a while.