Fig. 6.
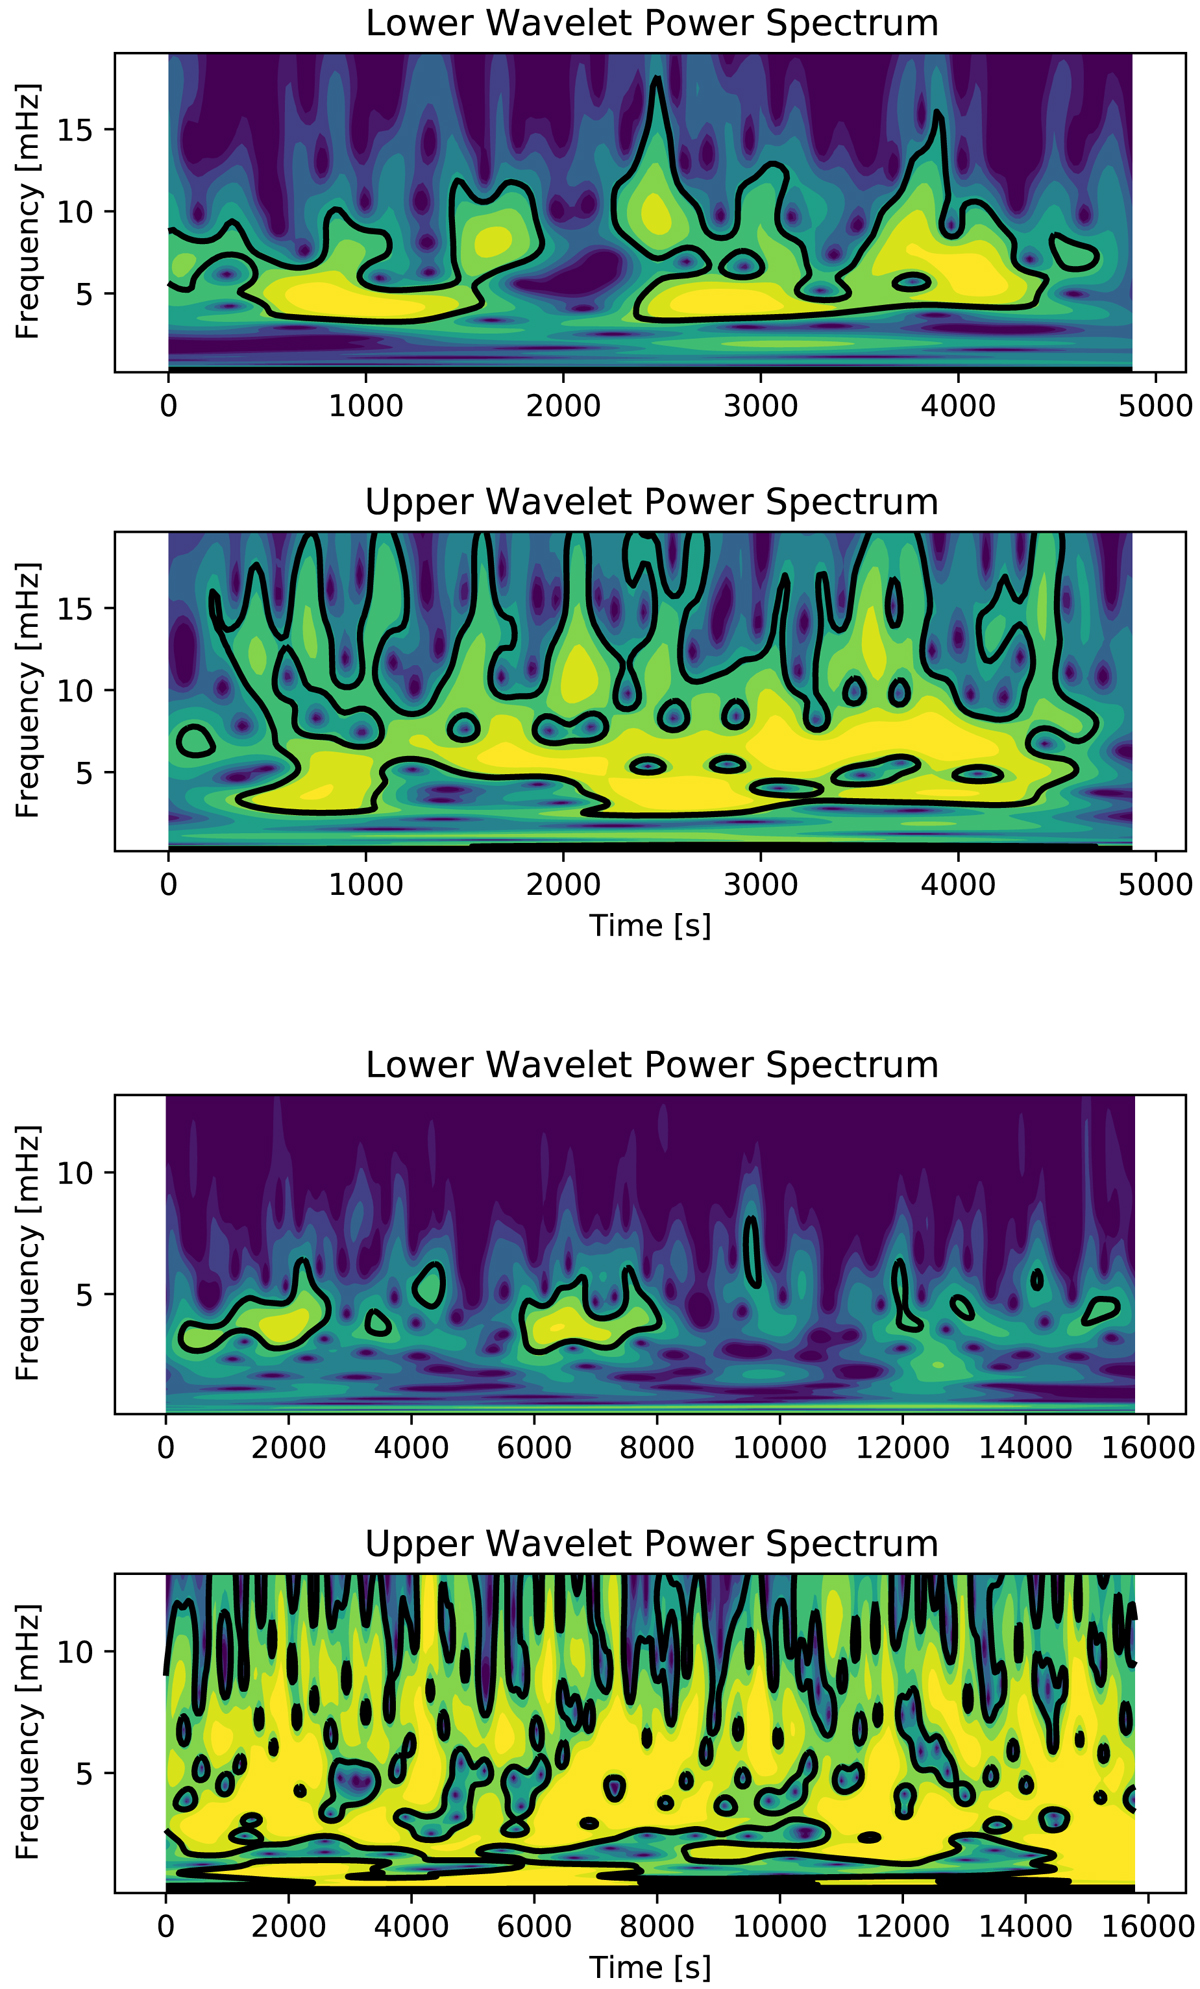
Examples of the wavelet power spectra computed for a pixel in the nonmagnetic atmosphere (upper pair of plots) and for a pixel classified as magnetized atmosphere (lower pair of plots), always for the lower- and upper-height boundary of the chromospheric layer under study. The solid black contours encircle the islands of statistical significance of the power.
Current usage metrics show cumulative count of Article Views (full-text article views including HTML views, PDF and ePub downloads, according to the available data) and Abstracts Views on Vision4Press platform.
Data correspond to usage on the plateform after 2015. The current usage metrics is available 48-96 hours after online publication and is updated daily on week days.
Initial download of the metrics may take a while.