Fig. 4.
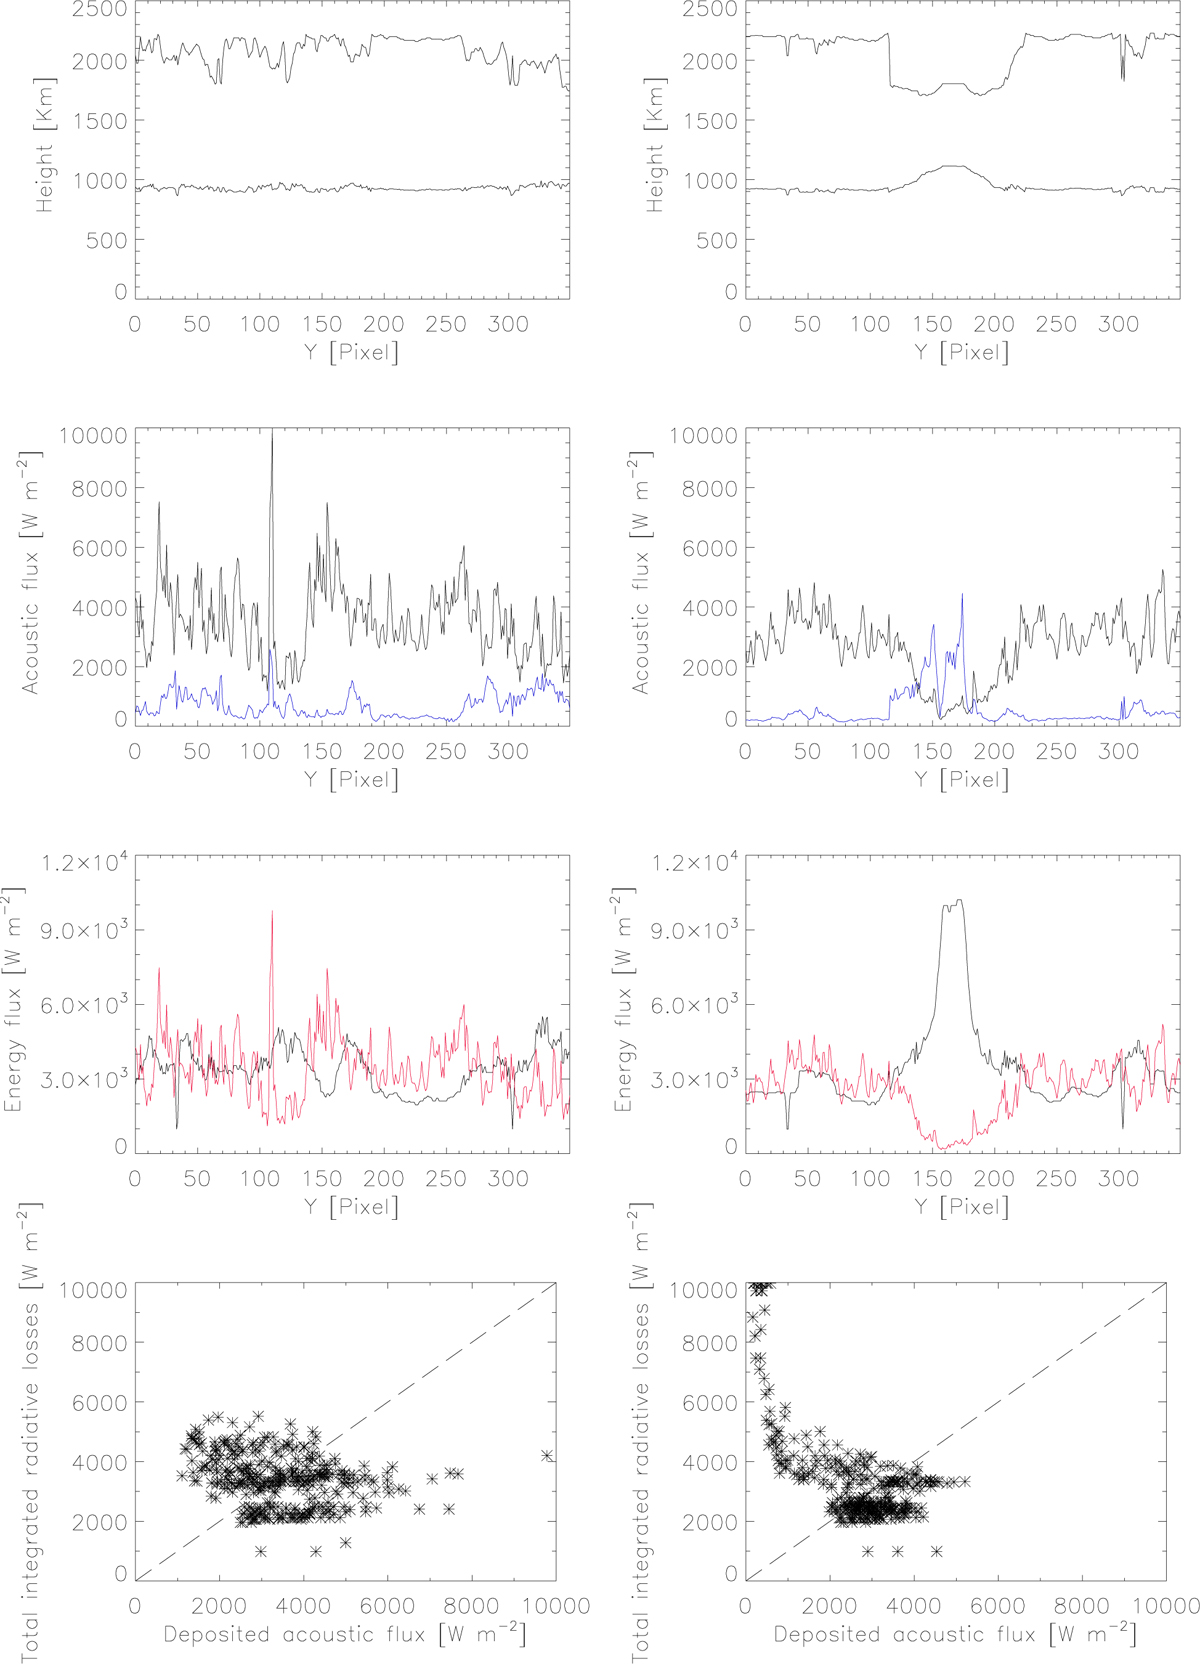
Lower and upper effective formation heights (first row), acoustic fluxes (second row), and energy fluxes (third row) along the slit in the typical quiet-Sun data set, QS11 (left), and active-region data set, AR10 (right). In the acoustic-flux plots, black lines correspond to incoming acoustic fluxes and blue ones to outgoing acoustic fluxes multiplied by ten. In the energy-flux plots, red lines correspond to deposited acoustic fluxes and black ones to total integrated radiative losses. Scatter plots of these quantities are in the fourth row. Straight dashed lines represent the full balance of radiative losses by acoustic-flux deposit.
Current usage metrics show cumulative count of Article Views (full-text article views including HTML views, PDF and ePub downloads, according to the available data) and Abstracts Views on Vision4Press platform.
Data correspond to usage on the plateform after 2015. The current usage metrics is available 48-96 hours after online publication and is updated daily on week days.
Initial download of the metrics may take a while.