Fig. 1.
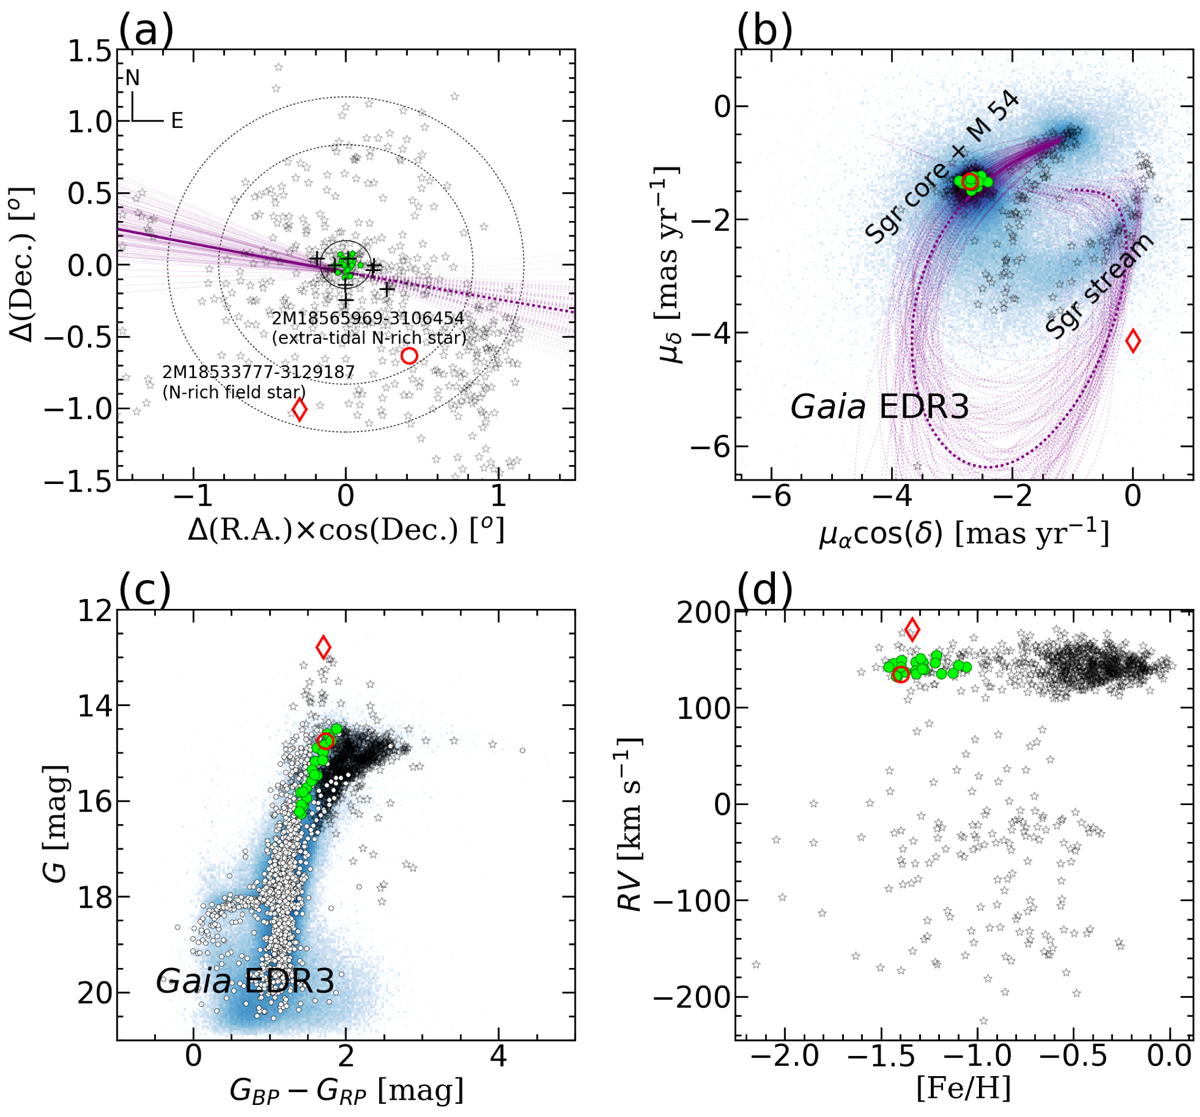
Properties of the potential extra-tidal stars compared with likely members of M 54. Panel a: spatial positions of the stars in our sample, with the tidal radius (rt = 10′) of M 54 over-plotted with a solid line. The open red symbols designate N-rich stars, the diamond symbol refers to a field star, and the open circle highlights the extra-tidal member of M 54. The lime circles designate the M 54 population analyzed in this work, while the black plus symbols designate the stars analyzed by Nataf et al. (2019). The empty gray star symbols designate the potential Sgr population from Hayes et al. (2020). The two concentric circles indicate 5 rt and 7 rt for reference. Panel b: Gaia EDR3 proper motions of stars that are associated with the Sgr stream: blue symbols for the Antoja et al. (2020) stars and open black star symbols for Hayes et al. (2020) stars. The orbital path of Sgr is shown by the dotted (backward) and solid (forward) purple line in panels a and b; the thick and thin lines show the central orbit, and an ensemble of 100 orbits that shows the more probable regions of the space, which are crossed more frequently by the simulated orbit, respectively. Panel c: color magnitude diagram from Gaia EDR3 photometry of our sample. The symbols are the same as in panels a and b, except the white circles, which denotes the M 54 members from Gaia EDR3, selected on proper motions and within 3′ from the cluster center. Panel d: radial velocities vs. [Fe/H] ratios determined from APOGEE-2/ASPCAP (black symbols) and our [Fe/H] ratio determinations from BACCHUS (green and red symbols) in the field around M 54. The [Fe/H] APOGEE-2/ASPCAP determinations are systematically offset by ∼0.11 dex to compare with our [Fe/H] BACCHUS determinations, as suggested in Fernández-Trincado et al. (2020b).
Current usage metrics show cumulative count of Article Views (full-text article views including HTML views, PDF and ePub downloads, according to the available data) and Abstracts Views on Vision4Press platform.
Data correspond to usage on the plateform after 2015. The current usage metrics is available 48-96 hours after online publication and is updated daily on week days.
Initial download of the metrics may take a while.