Fig. 4.
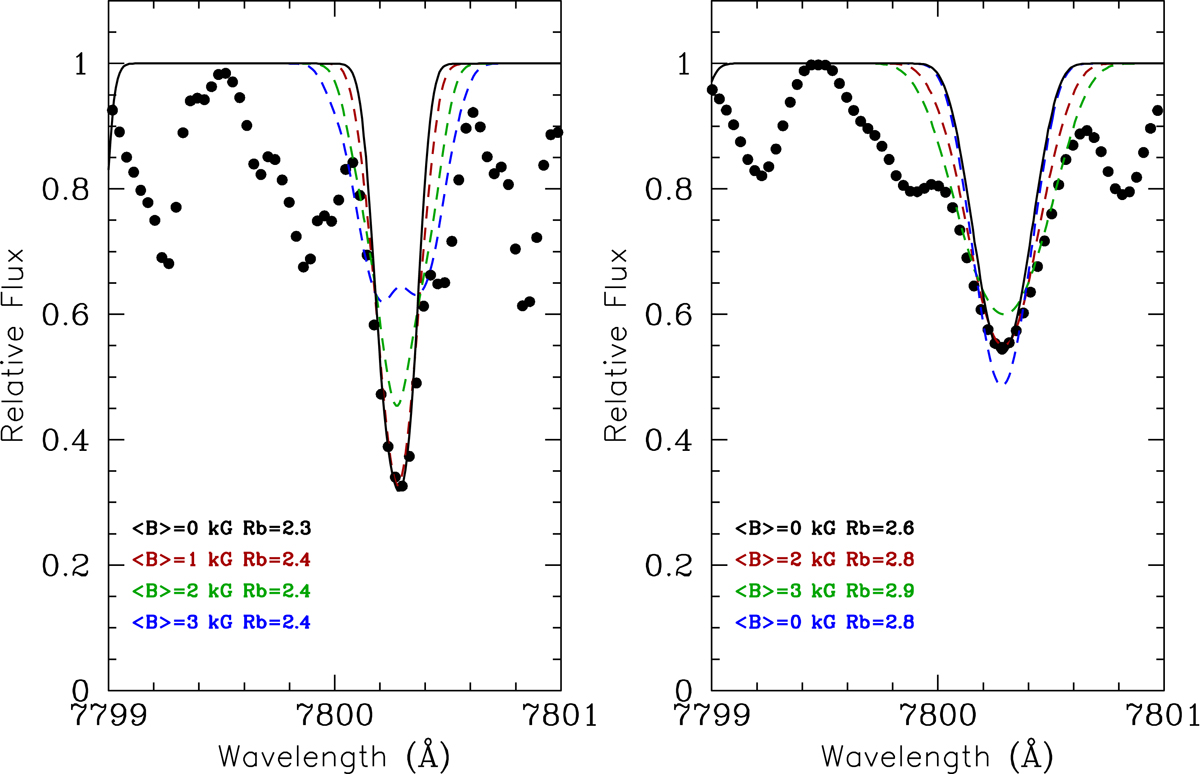
Comparison of the observed spectrum (black dots) at the location of the λ7800 Å of Rb I line for the M dwarfs G244-77 (non-active, left panel) and OT Ser (active, right panel) studied in Paper I, with synthetic spectra (continuous and dashed lines) computed with different average magnetic field intensities in the line of sight and Rb abundances (as labelled). Only the Rb I line is included in the spectral synthesis (see text for details).
Current usage metrics show cumulative count of Article Views (full-text article views including HTML views, PDF and ePub downloads, according to the available data) and Abstracts Views on Vision4Press platform.
Data correspond to usage on the plateform after 2015. The current usage metrics is available 48-96 hours after online publication and is updated daily on week days.
Initial download of the metrics may take a while.