Fig. 3.
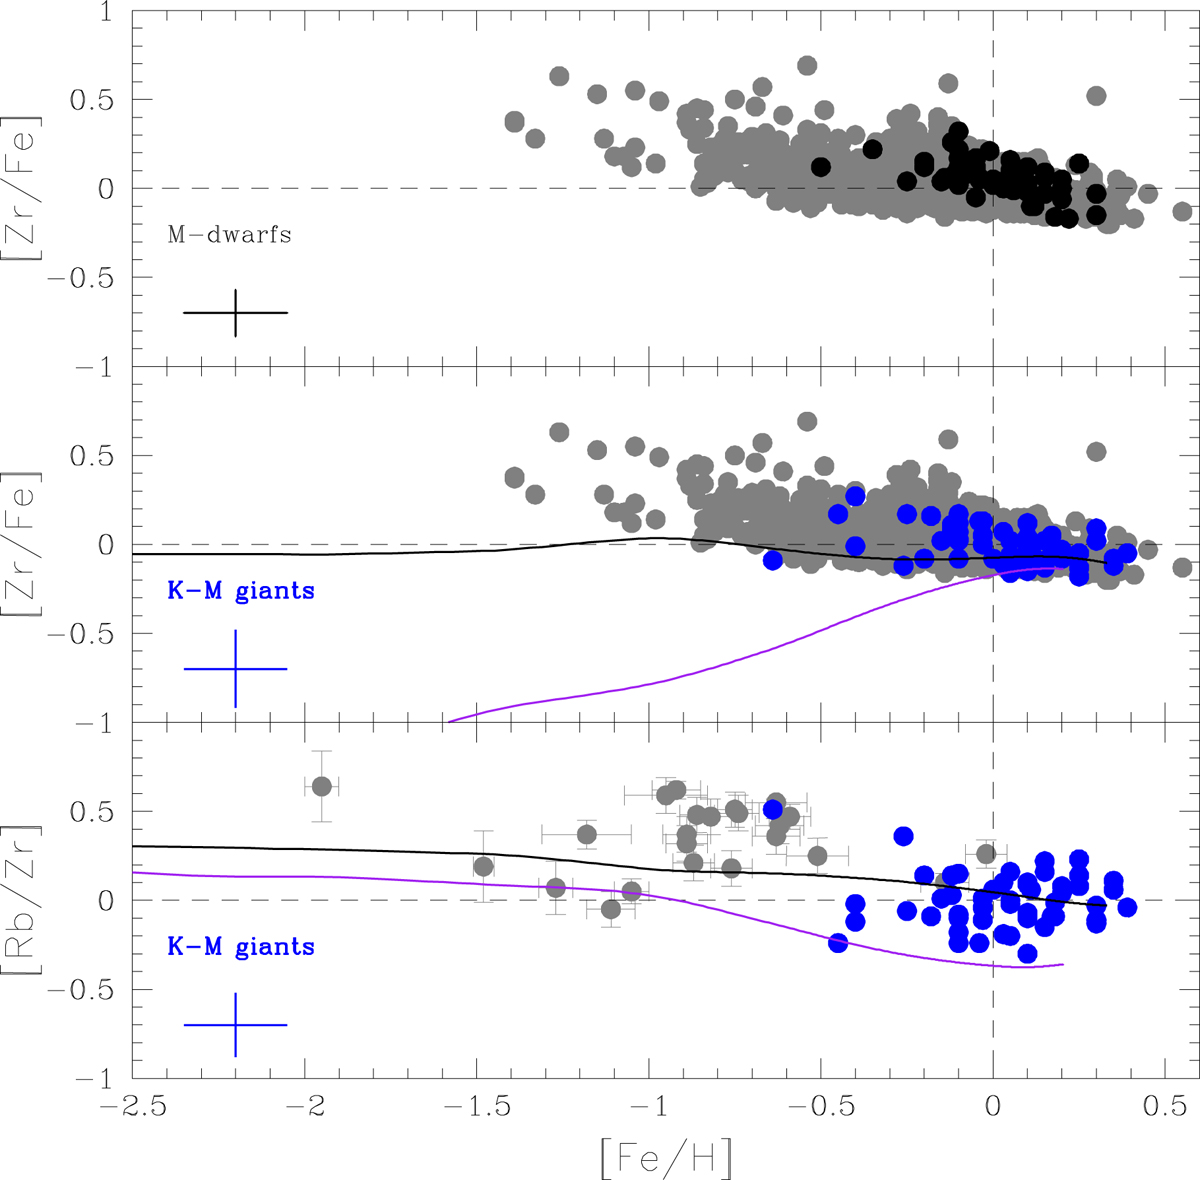
[Zr/Fe] vs. [Fe/H] diagram for the M dwarfs in Paper I and the stars studied here. Top and middle panels: same as Fig. 2 for LTE [Zr/Fe] vs. [Fe/H] for M dwarfs (top panel, black dots) and for KM-type giants (blue dots, middle panel). Grey dots are the [Zr/Fe] ratios derived by Battistini & Bensby (2016) and Delgado Mena et al. (2017), both in thin and thick disc dwarf stars. Bottom panel: [Rb/Zr] vs. [Fe/H] for the stars in this study (blue dots) when using NLTE Rb abundances. Grey dots correspond to the giants and dwarfs stars analysed in common by Gratton & Sneden (1994), Tomkin & Lambert (1999), and Mishenina et al. (2019). A typical error bar in the abundance ratios is shown in the bottom left corner of each panel. For the data in the literature (grey dots) the error bars have been omitted for clarity. Upper limits in the Zr abundance have been also omitted. Continuous solid lines in middle and bottom panels are the GCE predictions as in Fig. 2.
Current usage metrics show cumulative count of Article Views (full-text article views including HTML views, PDF and ePub downloads, according to the available data) and Abstracts Views on Vision4Press platform.
Data correspond to usage on the plateform after 2015. The current usage metrics is available 48-96 hours after online publication and is updated daily on week days.
Initial download of the metrics may take a while.