Fig. 7.
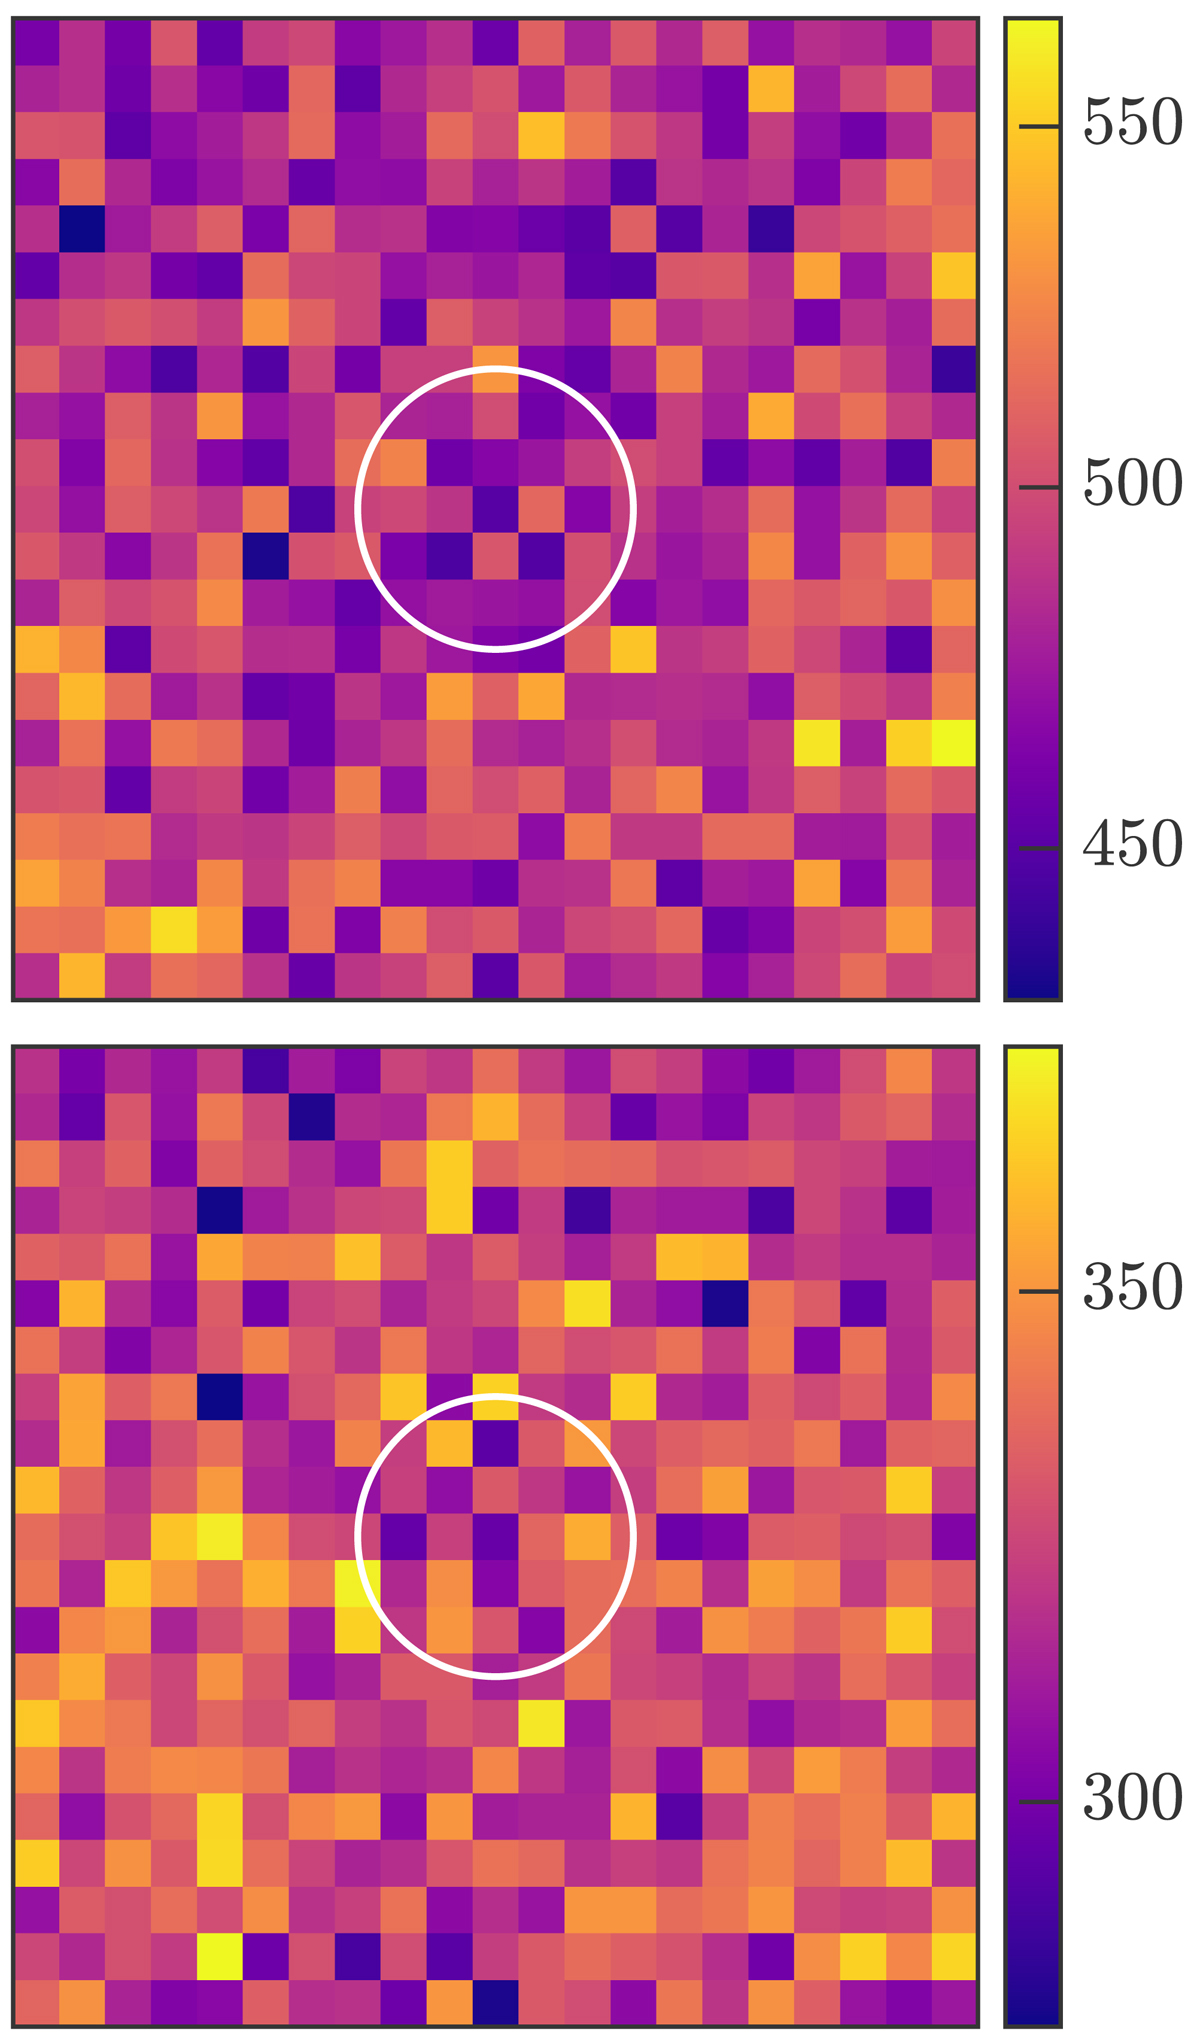
Stacked X-ray image of all the optically identified lensed sources after removing the 11 X-ray detected sources and clipping the extreme photometry values as described in the text. Images are 10″ across, and the color scale indicates net counts. Upper and lower panels: soft and hard bands, respectively. The white circle marks the 3 arcsec aperture we used for photometry in the stacked images.
Current usage metrics show cumulative count of Article Views (full-text article views including HTML views, PDF and ePub downloads, according to the available data) and Abstracts Views on Vision4Press platform.
Data correspond to usage on the plateform after 2015. The current usage metrics is available 48-96 hours after online publication and is updated daily on week days.
Initial download of the metrics may take a while.