Free Access
Fig. 6.
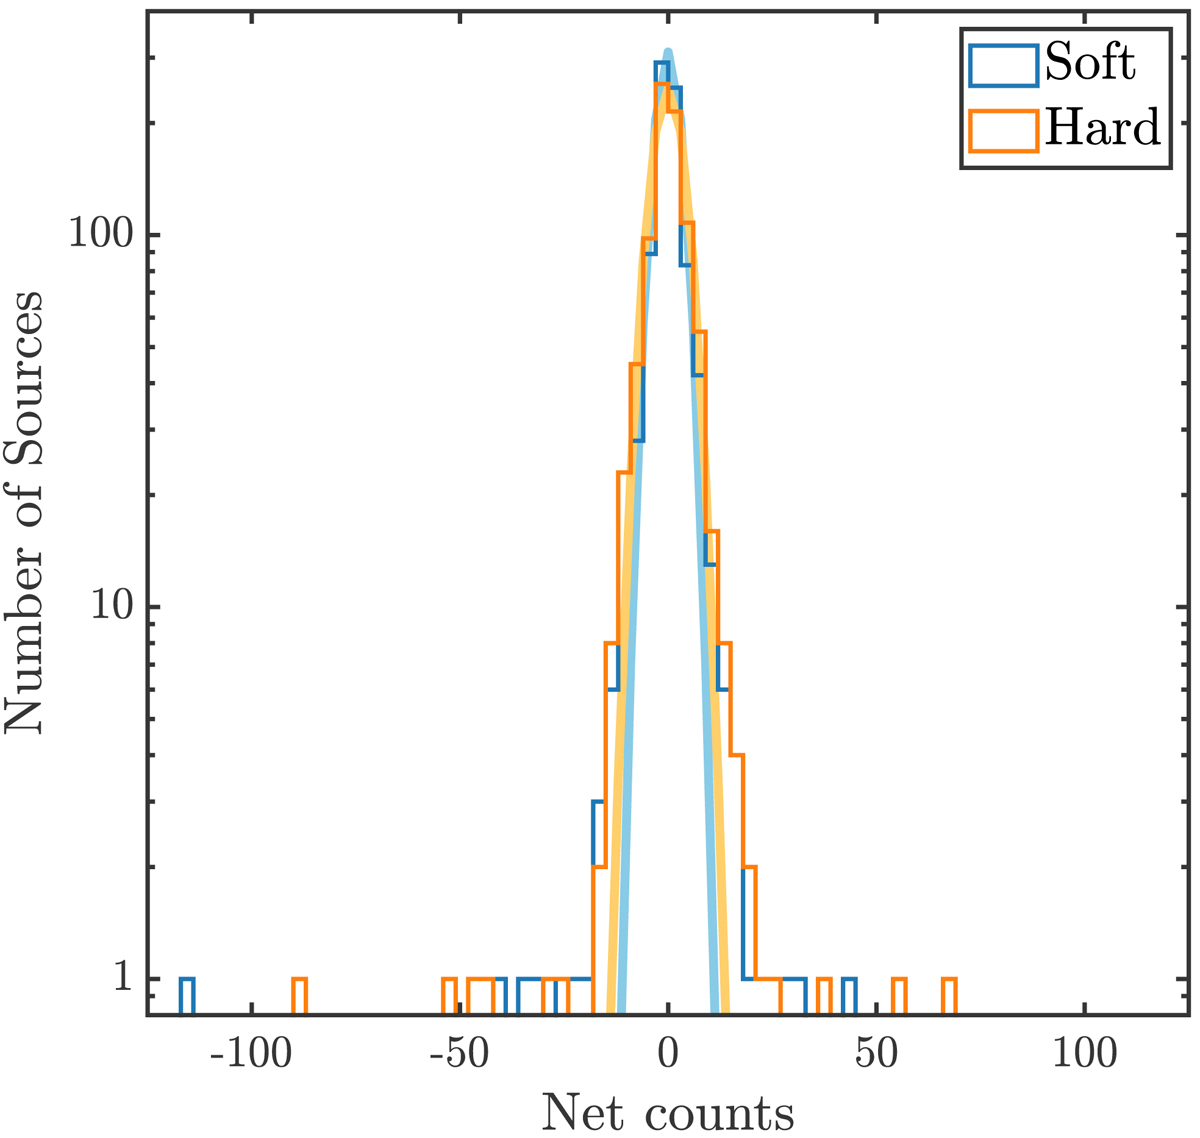
Histogram of aperture-photometry values in the soft and hard bands (cyan and orange histogram, respectively) for the 837 optically lensed sources in the 11 cluster fields after removing the visually identified sources listed in Table 3. The thick solid lines show the normalized best-fit Gaussian functions.
Current usage metrics show cumulative count of Article Views (full-text article views including HTML views, PDF and ePub downloads, according to the available data) and Abstracts Views on Vision4Press platform.
Data correspond to usage on the plateform after 2015. The current usage metrics is available 48-96 hours after online publication and is updated daily on week days.
Initial download of the metrics may take a while.