Free Access
Fig. 18.
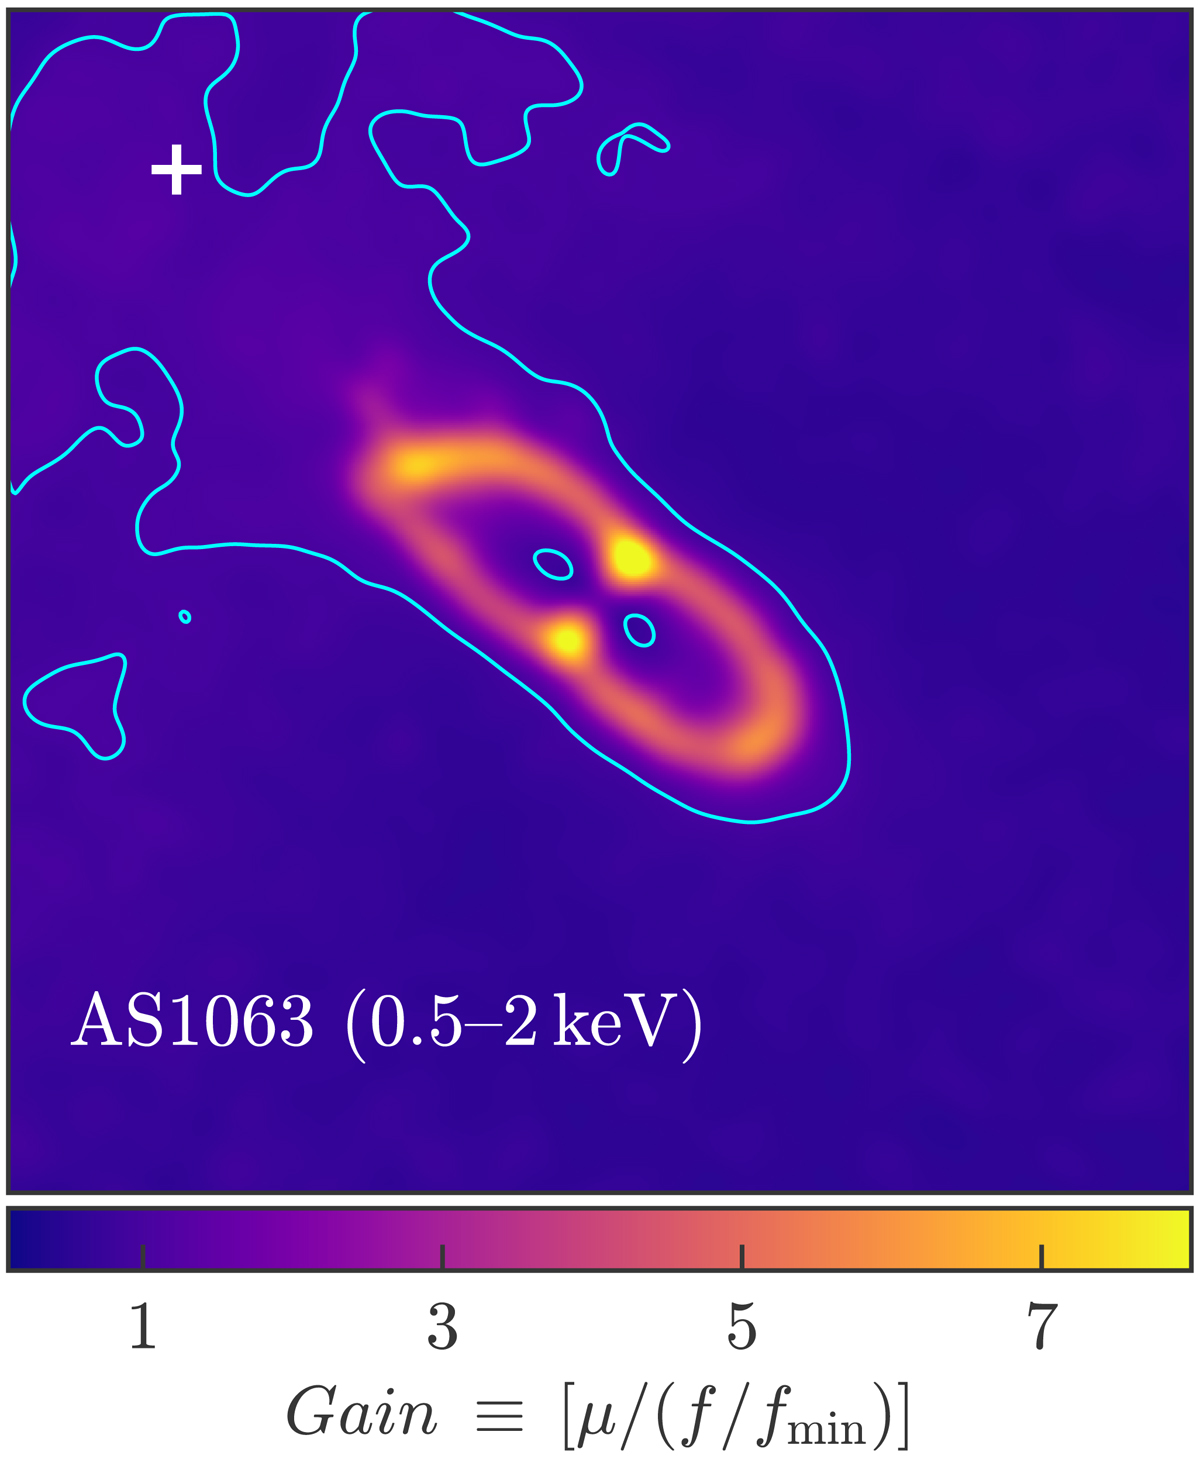
Gain map for the field of AS1063 in the soft band. The contours mark the transition from the region with Gain < 1 to that with Gain > 1, where the magnification due to strong lensing exceeds the sensitivity loss due to the ICM emission and the PSF smearing. The white cross marks the position of the smallest PSF size.
Current usage metrics show cumulative count of Article Views (full-text article views including HTML views, PDF and ePub downloads, according to the available data) and Abstracts Views on Vision4Press platform.
Data correspond to usage on the plateform after 2015. The current usage metrics is available 48-96 hours after online publication and is updated daily on week days.
Initial download of the metrics may take a while.