Fig. 16.
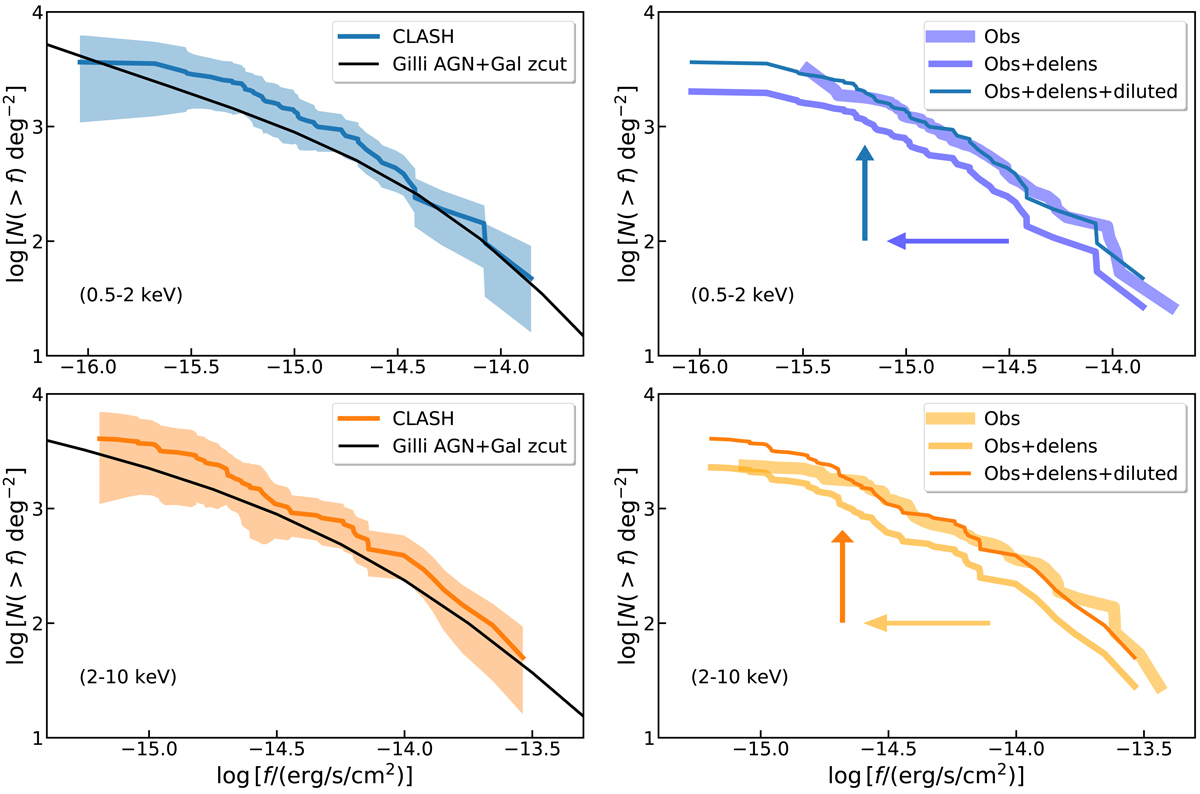
Number counts of sources detected in the CLASH fields as a function of flux. Left panels: cumulative number counts of the lensed sources in the soft band (upper left) and hard band (lower left). The number counts are compared with the prediction by the model of Gilli et al. (2007) after removing the foreground sources. Right panels: effects of the flux magnification and source dilution shown separately in the soft band (upper right) and hard band (lower right).
Current usage metrics show cumulative count of Article Views (full-text article views including HTML views, PDF and ePub downloads, according to the available data) and Abstracts Views on Vision4Press platform.
Data correspond to usage on the plateform after 2015. The current usage metrics is available 48-96 hours after online publication and is updated daily on week days.
Initial download of the metrics may take a while.