Fig. 14.
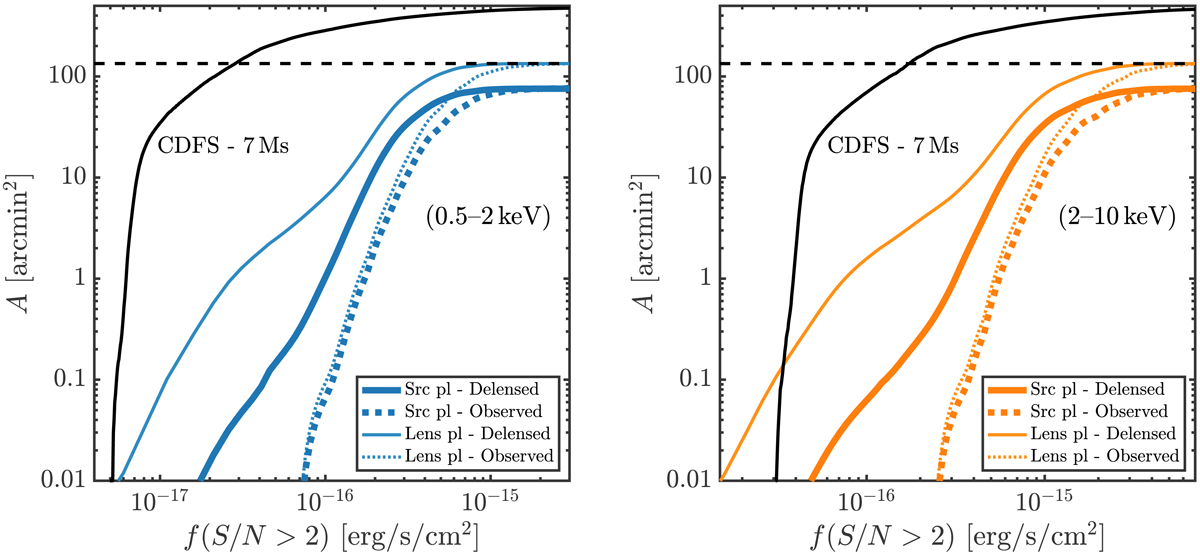
Sky coverage as a function of flux for the 11 CLASH cluster fields. The thick solid curve shows the sky coverage in the source plane as a function of the de-lensed flux in the soft (left panel) and hard (right panel) bands. The thick dotted curve instead shows the same sky coverage in the source plane, but as a function of the observed flux. The sky coverage in the source plane was used to compute the delensed log N–log S. The sky coverage in the lens plane is also shown as a function of the delensed flux (continuous curve) and of the observed flux (thin dotted curve). The horizontal dashed line indicates the total solid angle, by the criterion μmax > 1.5. The black curve shows the sky coverage of the 7 Ms CDFS survey in the corresponding energy ranges (Luo et al. 2017). The hard-band flux limits in Luo et al. (2017) given in 2−7 keV are converted into 2−10 keV by assuming Γ = 1.8.
Current usage metrics show cumulative count of Article Views (full-text article views including HTML views, PDF and ePub downloads, according to the available data) and Abstracts Views on Vision4Press platform.
Data correspond to usage on the plateform after 2015. The current usage metrics is available 48-96 hours after online publication and is updated daily on week days.
Initial download of the metrics may take a while.