Fig. 11.
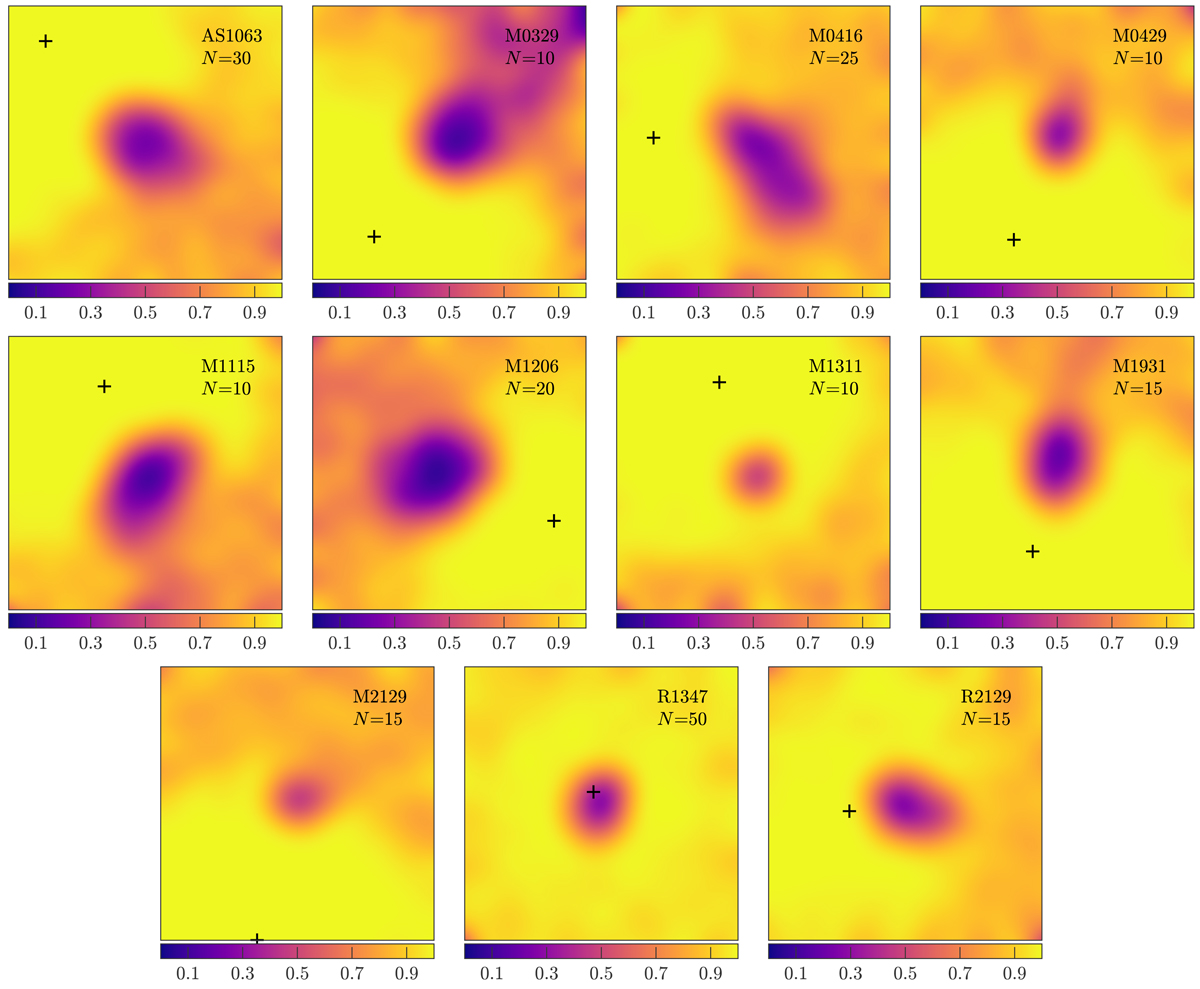
Completeness maps in the 0.5−2 keV band for all the sources with S/N > 2 detected with wavdetect in the 11 cluster fields. The color code indicates the completeness or recovery rate at a given input net counts N, as shown in the color bar, in the 0.5−2 keV band. The maps are 5′ across and are smoothed with a Gaussian FWHM of 10″. The black crosses mark the position of minimum PSF in each field, resulting from the overlapping of several exposures with different aim points. The low recovery rates in cluster centers and in the corners of the field of view are due to the strong ICM emission and the increase in PSF size, respectively.
Current usage metrics show cumulative count of Article Views (full-text article views including HTML views, PDF and ePub downloads, according to the available data) and Abstracts Views on Vision4Press platform.
Data correspond to usage on the plateform after 2015. The current usage metrics is available 48-96 hours after online publication and is updated daily on week days.
Initial download of the metrics may take a while.