Fig. 10.
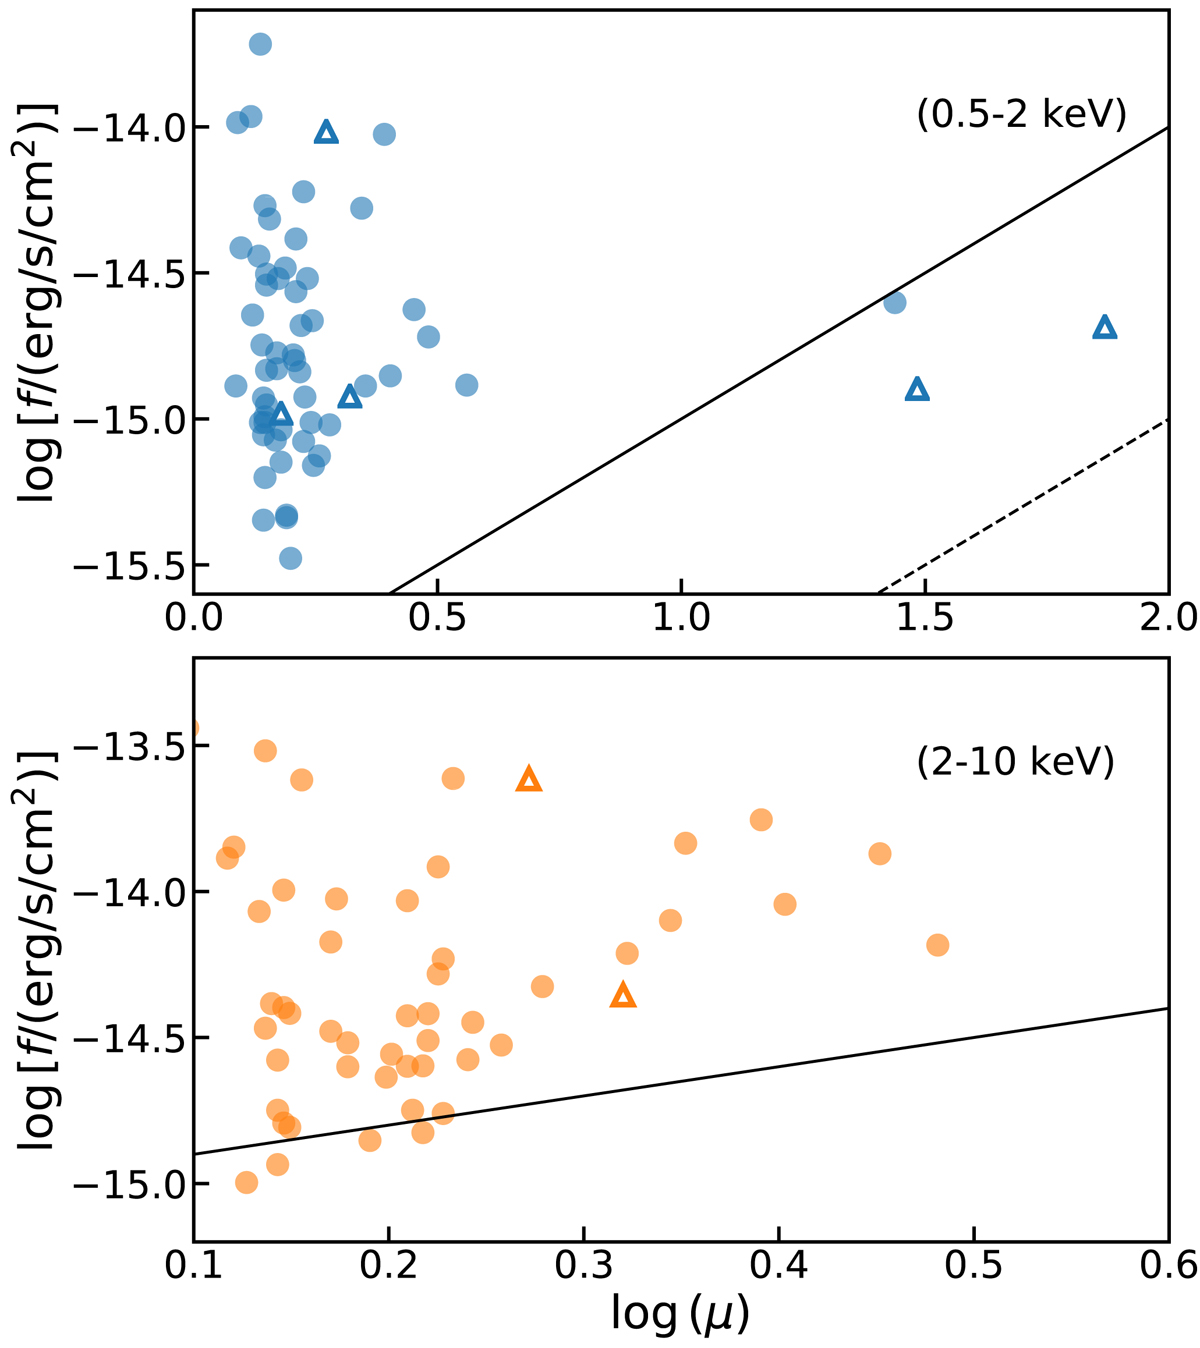
Scatter plot of the soft (top panel) and hard (bottom panel) observed flux vs. the weighted magnification. Top panel: the region below the solid and dashed black lines corresponds to delensed fluxes below 10−16 and 10−17 erg s−1 cm−2, respectively. Bottom panel: the region below the black line corresponds to delensed fluxes below 10−15 erg s−1 cm−2. Sources marked with circles are X-ray selected, and triangles correspond to sources identified as X-ray counterparts of optically lensed sources (listed in Table 3). Only sources with S/N ≥ 2 in each band are shown.
Current usage metrics show cumulative count of Article Views (full-text article views including HTML views, PDF and ePub downloads, according to the available data) and Abstracts Views on Vision4Press platform.
Data correspond to usage on the plateform after 2015. The current usage metrics is available 48-96 hours after online publication and is updated daily on week days.
Initial download of the metrics may take a while.